• Laser & Optoelectronics Progress
  • Vol. 57, Issue 23, 230401 (2020)
Min Hu1、2, Xia Xiao1、2、*, Hang Song1、2, and Yu Liu1、2
Author Affiliations
  • 1School of Microelectronics, Tianjin University, Tianjin 300072, China
  • 2Tianjin Key Laboratory of Imaging and Sensing Microelectronic Technology, Tianjin 300072, China
  • show less
    DOI: 10.3788/LOP57.230401 Cite this Article Set citation alerts
    Min Hu, Xia Xiao, Hang Song, Yu Liu. Microwave Non-Invasive Blood Glucose Detection Based on Debye Model[J]. Laser & Optoelectronics Progress, 2020, 57(23): 230401 Copy Citation Text show less
    Diagram of open-end coaxial probe measurement principle
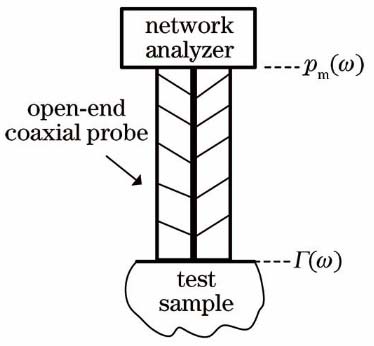
    Fig. 1. Diagram of open-end coaxial probe measurement principle
    Experimental device. (a) Measurement equipment; (b) open-end coaxial probe; (c) network analyzer
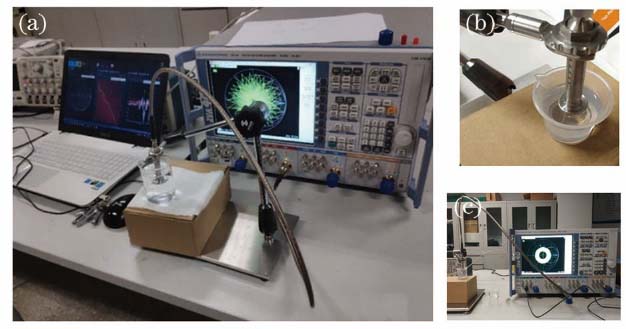
    Fig. 2. Experimental device. (a) Measurement equipment; (b) open-end coaxial probe; (c) network analyzer
    Dielectric properties of glucose aqueous solution with different concentrations. (a) Dielectric constant; (b) conductivity
    Fig. 3. Dielectric properties of glucose aqueous solution with different concentrations. (a) Dielectric constant; (b) conductivity
    Fitting relation between Debye parameters and glucose aqueous solution concentration. (a) ε∞; (b) Δε; (c) τ
    Fig. 4. Fitting relation between Debye parameters and glucose aqueous solution concentration. (a) ε; (b) Δε; (c) τ
    Single-order Debye model fitting of glucose aqueous solution with concentration of 200 mg·dl-1. (a) Dielectric constant; (b) conductivity
    Fig. 5. Single-order Debye model fitting of glucose aqueous solution with concentration of 200 mg·dl-1. (a) Dielectric constant; (b) conductivity
    Dielectric properties of five aqueous glucose solutions reconstructed by single-order Debye model. (a) Dielectric constant; (b) conductivity
    Fig. 6. Dielectric properties of five aqueous glucose solutions reconstructed by single-order Debye model. (a) Dielectric constant; (b) conductivity
    Five-layer earlobe electromagnetic model and transceiver antenna
    Fig. 7. Five-layer earlobe electromagnetic model and transceiver antenna
    Single-order Debye model of skin and fat. (a) Dielectric constant; (b) conductivity
    Fig. 8. Single-order Debye model of skin and fat. (a) Dielectric constant; (b) conductivity
    Microwave signal transmitted by transmitting antenna. (a) Time domain diagram; (b) frequency domain diagram
    Fig. 9. Microwave signal transmitted by transmitting antenna. (a) Time domain diagram; (b) frequency domain diagram
    Changes of S21 at different glucose concentrations. (a) S21; (b) S21 difference; (c) absolute value of S21 difference
    Fig. 10. Changes of S21 at different glucose concentrations. (a) S21; (b) S21 difference; (c) absolute value of S21 difference
    Relationship between absolute value of S21 difference and glucose concentration at different frequency points. (a) 1.35 GHz; (b) 1.63 GHz; (c) 3.25 GHz; (d) 4 GHz
    Fig. 11. Relationship between absolute value of S21 difference and glucose concentration at different frequency points. (a) 1.35 GHz; (b) 1.63 GHz; (c) 3.25 GHz; (d) 4 GHz
    Experimental environment. (a) Experimental device; (b) earlobe model and antenna
    Fig. 12. Experimental environment. (a) Experimental device; (b) earlobe model and antenna
    Experimental measurement results. (a) S21; (b) S21 difference; (c) absolute value of S21 difference
    Fig. 13. Experimental measurement results. (a) S21; (b) S21 difference; (c) absolute value of S21 difference
    Relationship between absolute value of S21 difference and glucose concentration at different frequency points
    Fig. 14. Relationship between absolute value of S21 difference and glucose concentration at different frequency points
    Concentration /(mg·dl-1)εΔετ /ps
    09.99169.1559.26
    10010.02869.0349.24
    20010.14268.7829.22
    30010.48368.3759.28
    40010.95667.9019.36
    50011.26767.5509.42
    60011.51467.2639.47
    70012.26066.4799.57
    80012.34266.3489.57
    90012.67065.9539.62
    100013.13365.4089.69
    Table 1. Fitting parameters of single-order Debye model of glucose aqueous solution with different concentrations
    Concentration /(mg·dl-1)DielectricconstantConductivity /(S·m-1)
    00.2710.097
    1000.2590.097
    2000.2550.096
    3000.3060.107
    4000.3050.109
    5000.3190.108
    6000.2920.112
    7000.3000.109
    8000.3090.105
    9000.2990.104
    10000.3070.105
    Table 2. Fitted RMSE of Debye model at different glucose concentrations
    ParameterRMSE
    ε0.131
    Δε0.033
    τ /ps0.031
    Table 3. RMSE of quadratic polynomial fitting of Debye parameters
    Biological tissueεεsτ /ps
    Skin22.768042.488925.3633
    Fat2.28464.60889.2819
    Table 4. Single-order Debye parameters of skin and fat
    Min Hu, Xia Xiao, Hang Song, Yu Liu. Microwave Non-Invasive Blood Glucose Detection Based on Debye Model[J]. Laser & Optoelectronics Progress, 2020, 57(23): 230401
    Download Citation