
Junqiang Wang, Jiansheng Li, Xuewen Zhou, Xu Zhang. Improved SSD Algorithm and Its Performance Analysis of Small Target Detection in Remote Sensing Images[J]. Acta Optica Sinica, 2019, 39(6): 0628005
- Acta Optica Sinica
- Vol. 39, Issue 6, 0628005 (2019)
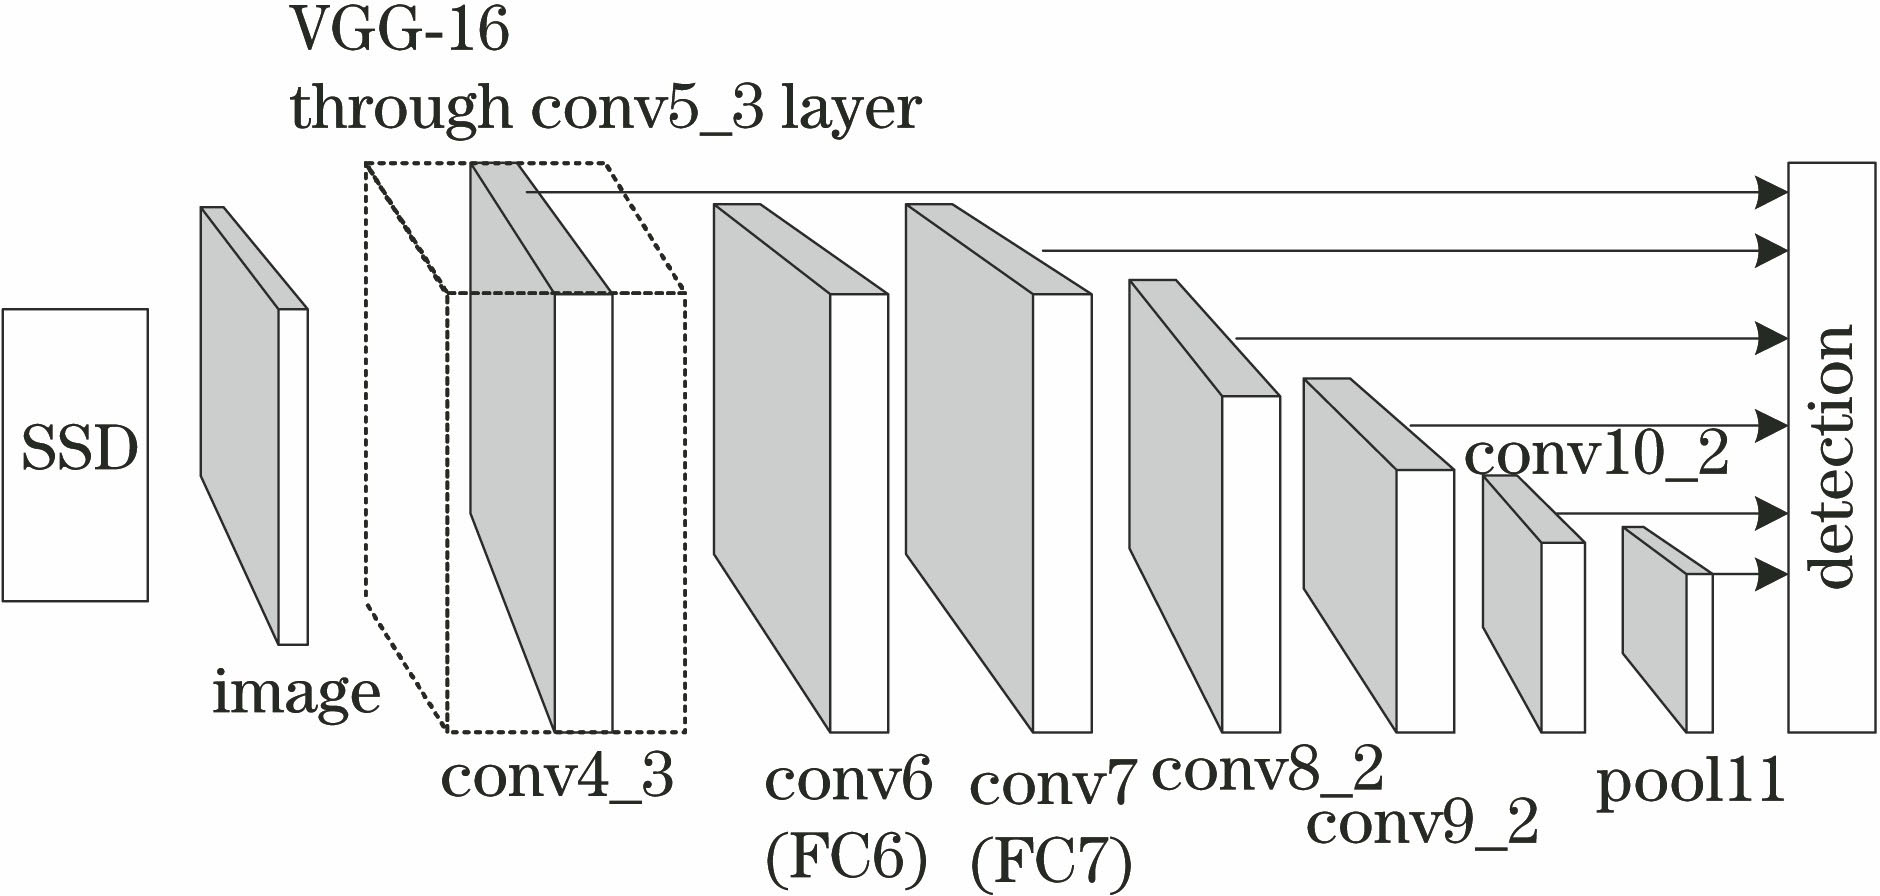
Fig. 1. Framework of SSD algorithm
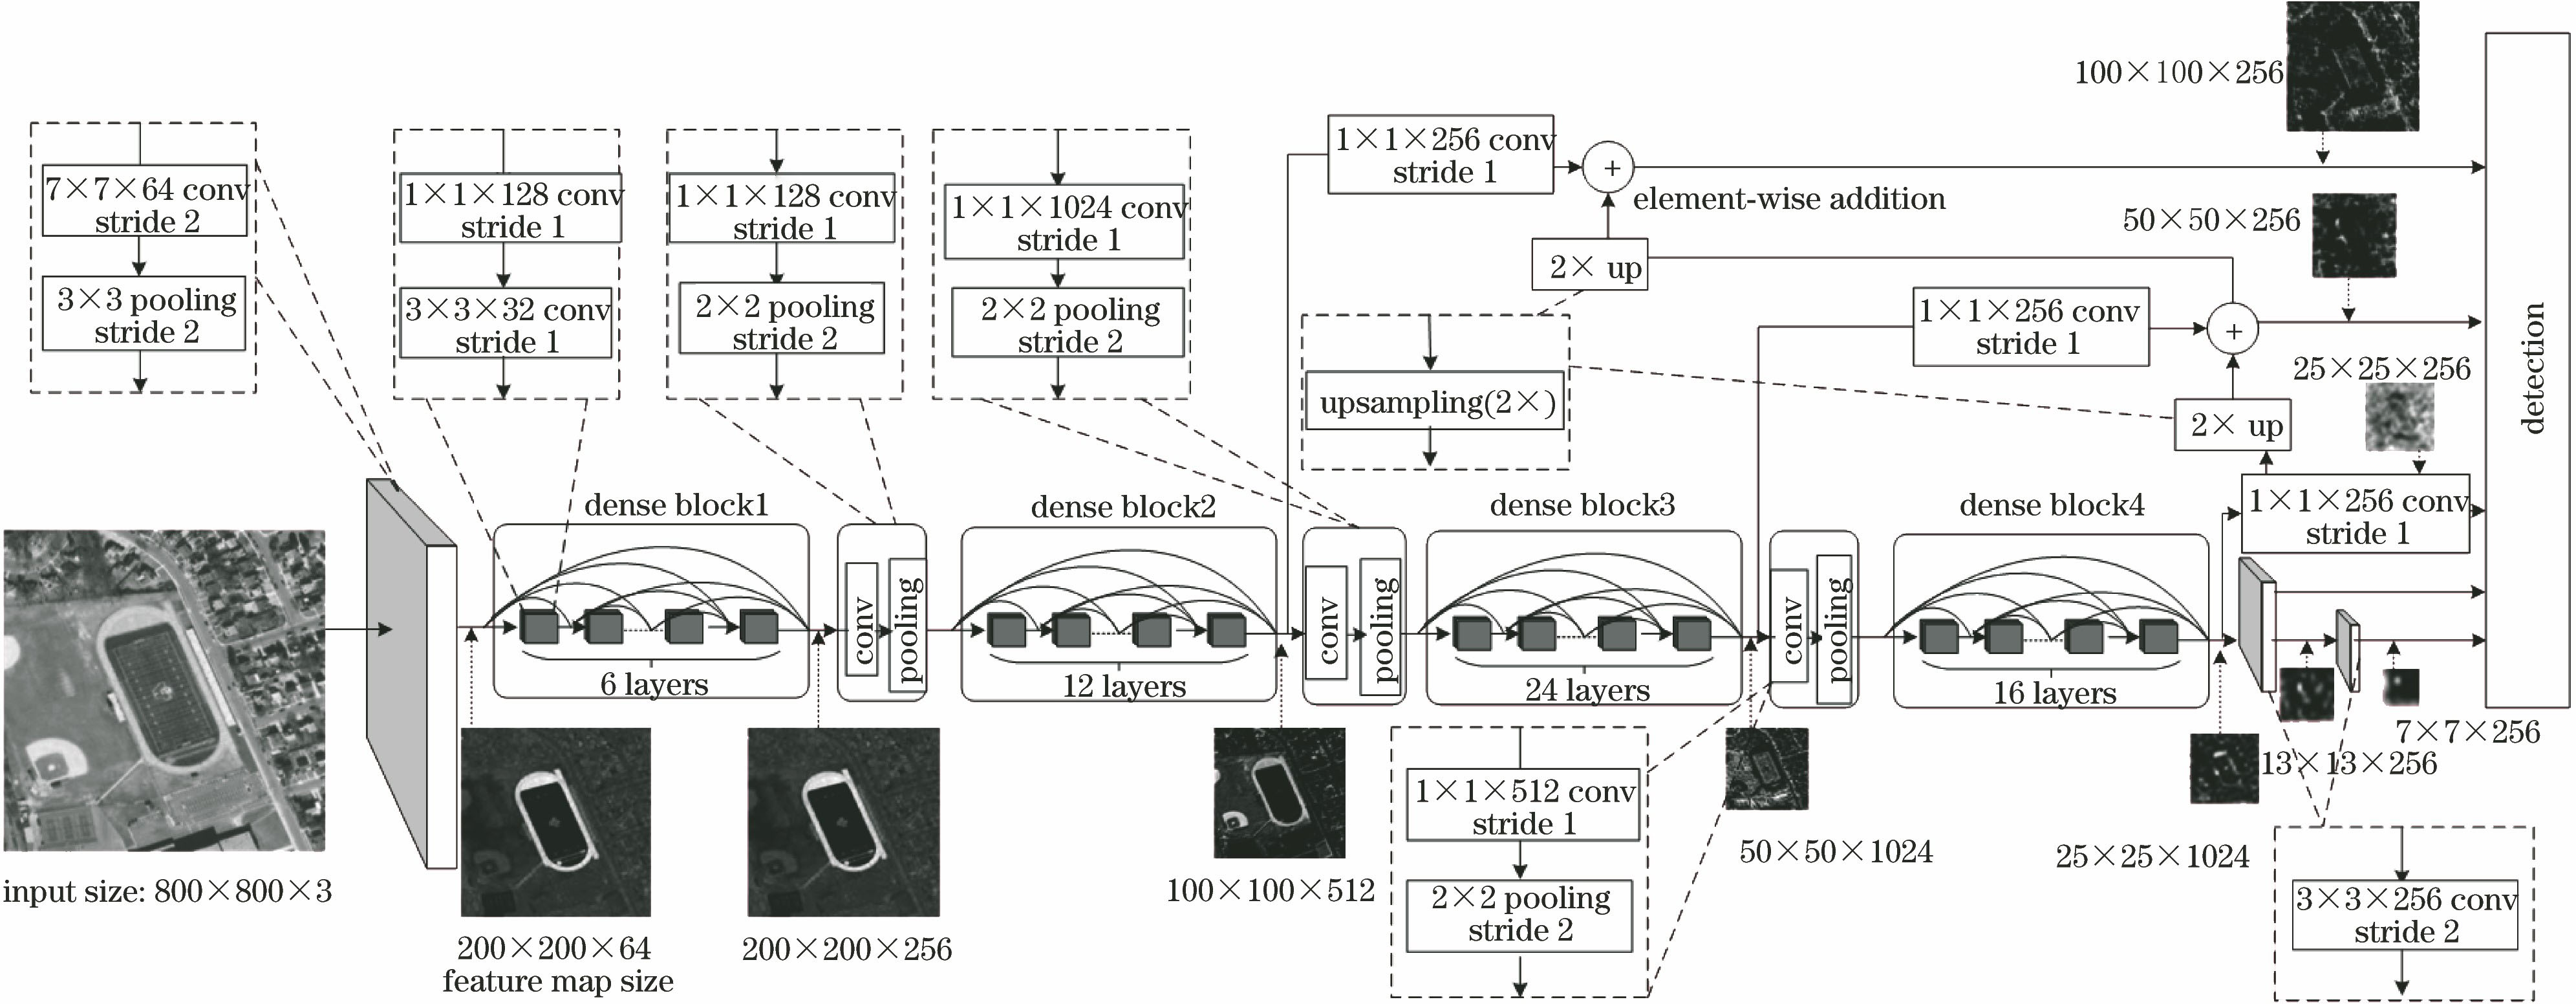
Fig. 2. Framework of improved SSD algorithm
Fig. 3. Comparison of feature maps before and after integration. (a) Input image; (b) output of dense block2; (c) output of dense block3; (d) output of dense block2 with feature integration; (e) output of dense block3 with feature integration; (f) output of dense block4
Fig. 4. Interface of training sample online acquisition system. (a) Superimposed main airport point data; (b) aircraft sample collection
Fig. 5. Size of each target in sample set
Fig. 6. Decay curve of learning rate
Fig. 7. Comparison of total loss and precision between transfer training and random initialization. (a) Total loss varies with number of iterations; (b) MAPRIoU=0.50 varies with number of iterations
Fig. 8. Comparison of precisions of improved SSD algorithm and other algorithms varying with number of iterations. (a) MAP; (b) MAPlarge; (c) MAPmedium; (d) MAPsmall; (e) MAPRIoU=0.50; (f) MAPRIoU=0.75
Fig. 9. Comparison of improved SSD algorithm and other algorithms in detection effect. (a) Faster R-CNN+ResNet101; (b) R-FCN+ResNet101; (c) improved SSD algorithm
|
Table 1. Main metrics
| |||||||||||||||||||||||||||||||||||||||||||||||||||||||||||||||||||||||||||||||||||||||||||||
Table 2. Sample set statistics
| ||||||||||||||||||||||||||||||||||||||||||||||||||||||||||||
Table 3. Comparison of calculation time and precision on validation set
| ||||||||||||||||||||||||||||||||||||||||||||||||
Table 4. Comparison of precision on test set

Set citation alerts for the article
Please enter your email address
© Copyright 2018-2021 | Chinese Laser Press. All Rights Reserved 沪ICP备15018463号-20