• Photonics Research
  • Vol. 8, Issue 3, 303 (2020)
Jingshun Pan1, Bin Zhang1、4、*, Zhengyong Liu1, Jiaxin Zhao1, Yuanhua Feng3, Lei Wan3, and Zhaohui Li1、2、5、*
Author Affiliations
  • 1Key Laboratory of Optoelectronic Materials and Technologies, School of Electrical and Information Technology, Sun Yat-sen University, Guangzhou 510275, China
  • 2Southern Marine Science and Engineering Guangdong Laboratory (Zhuhai), Zhuhai 519000, China
  • 3Department of Electronic Engineering, College of Information Science and Technology, Jinan University, Guangzhou 510632, China
  • 4e-mail: zhangbin5@mail.sysu.edu.cn
  • 5e-mail: lzhh88@mail.sysu.edu.cn
  • show less
    DOI: 10.1364/PRJ.376640 Cite this Article Set citation alerts
    Jingshun Pan, Bin Zhang, Zhengyong Liu, Jiaxin Zhao, Yuanhua Feng, Lei Wan, Zhaohui Li. Microbubble resonators combined with a digital optical frequency comb for high-precision air-coupled ultrasound detectors[J]. Photonics Research, 2020, 8(3): 303 Copy Citation Text show less
    Schematic of the experimental setup combining an MBR with the DOFC technique. TL, tunable laser; PC, polarization controller; AWG, arbitrary waveform generator; PD, photodetector; OSC, oscilloscope; SI, signal input; LO, local oscillator. (a) Microscopic image of the MBR with a diameter of 209 μm. (b) SEM image of the cross section of the MBR. (c) Schematic of the ultrasound detection using two MBRs.
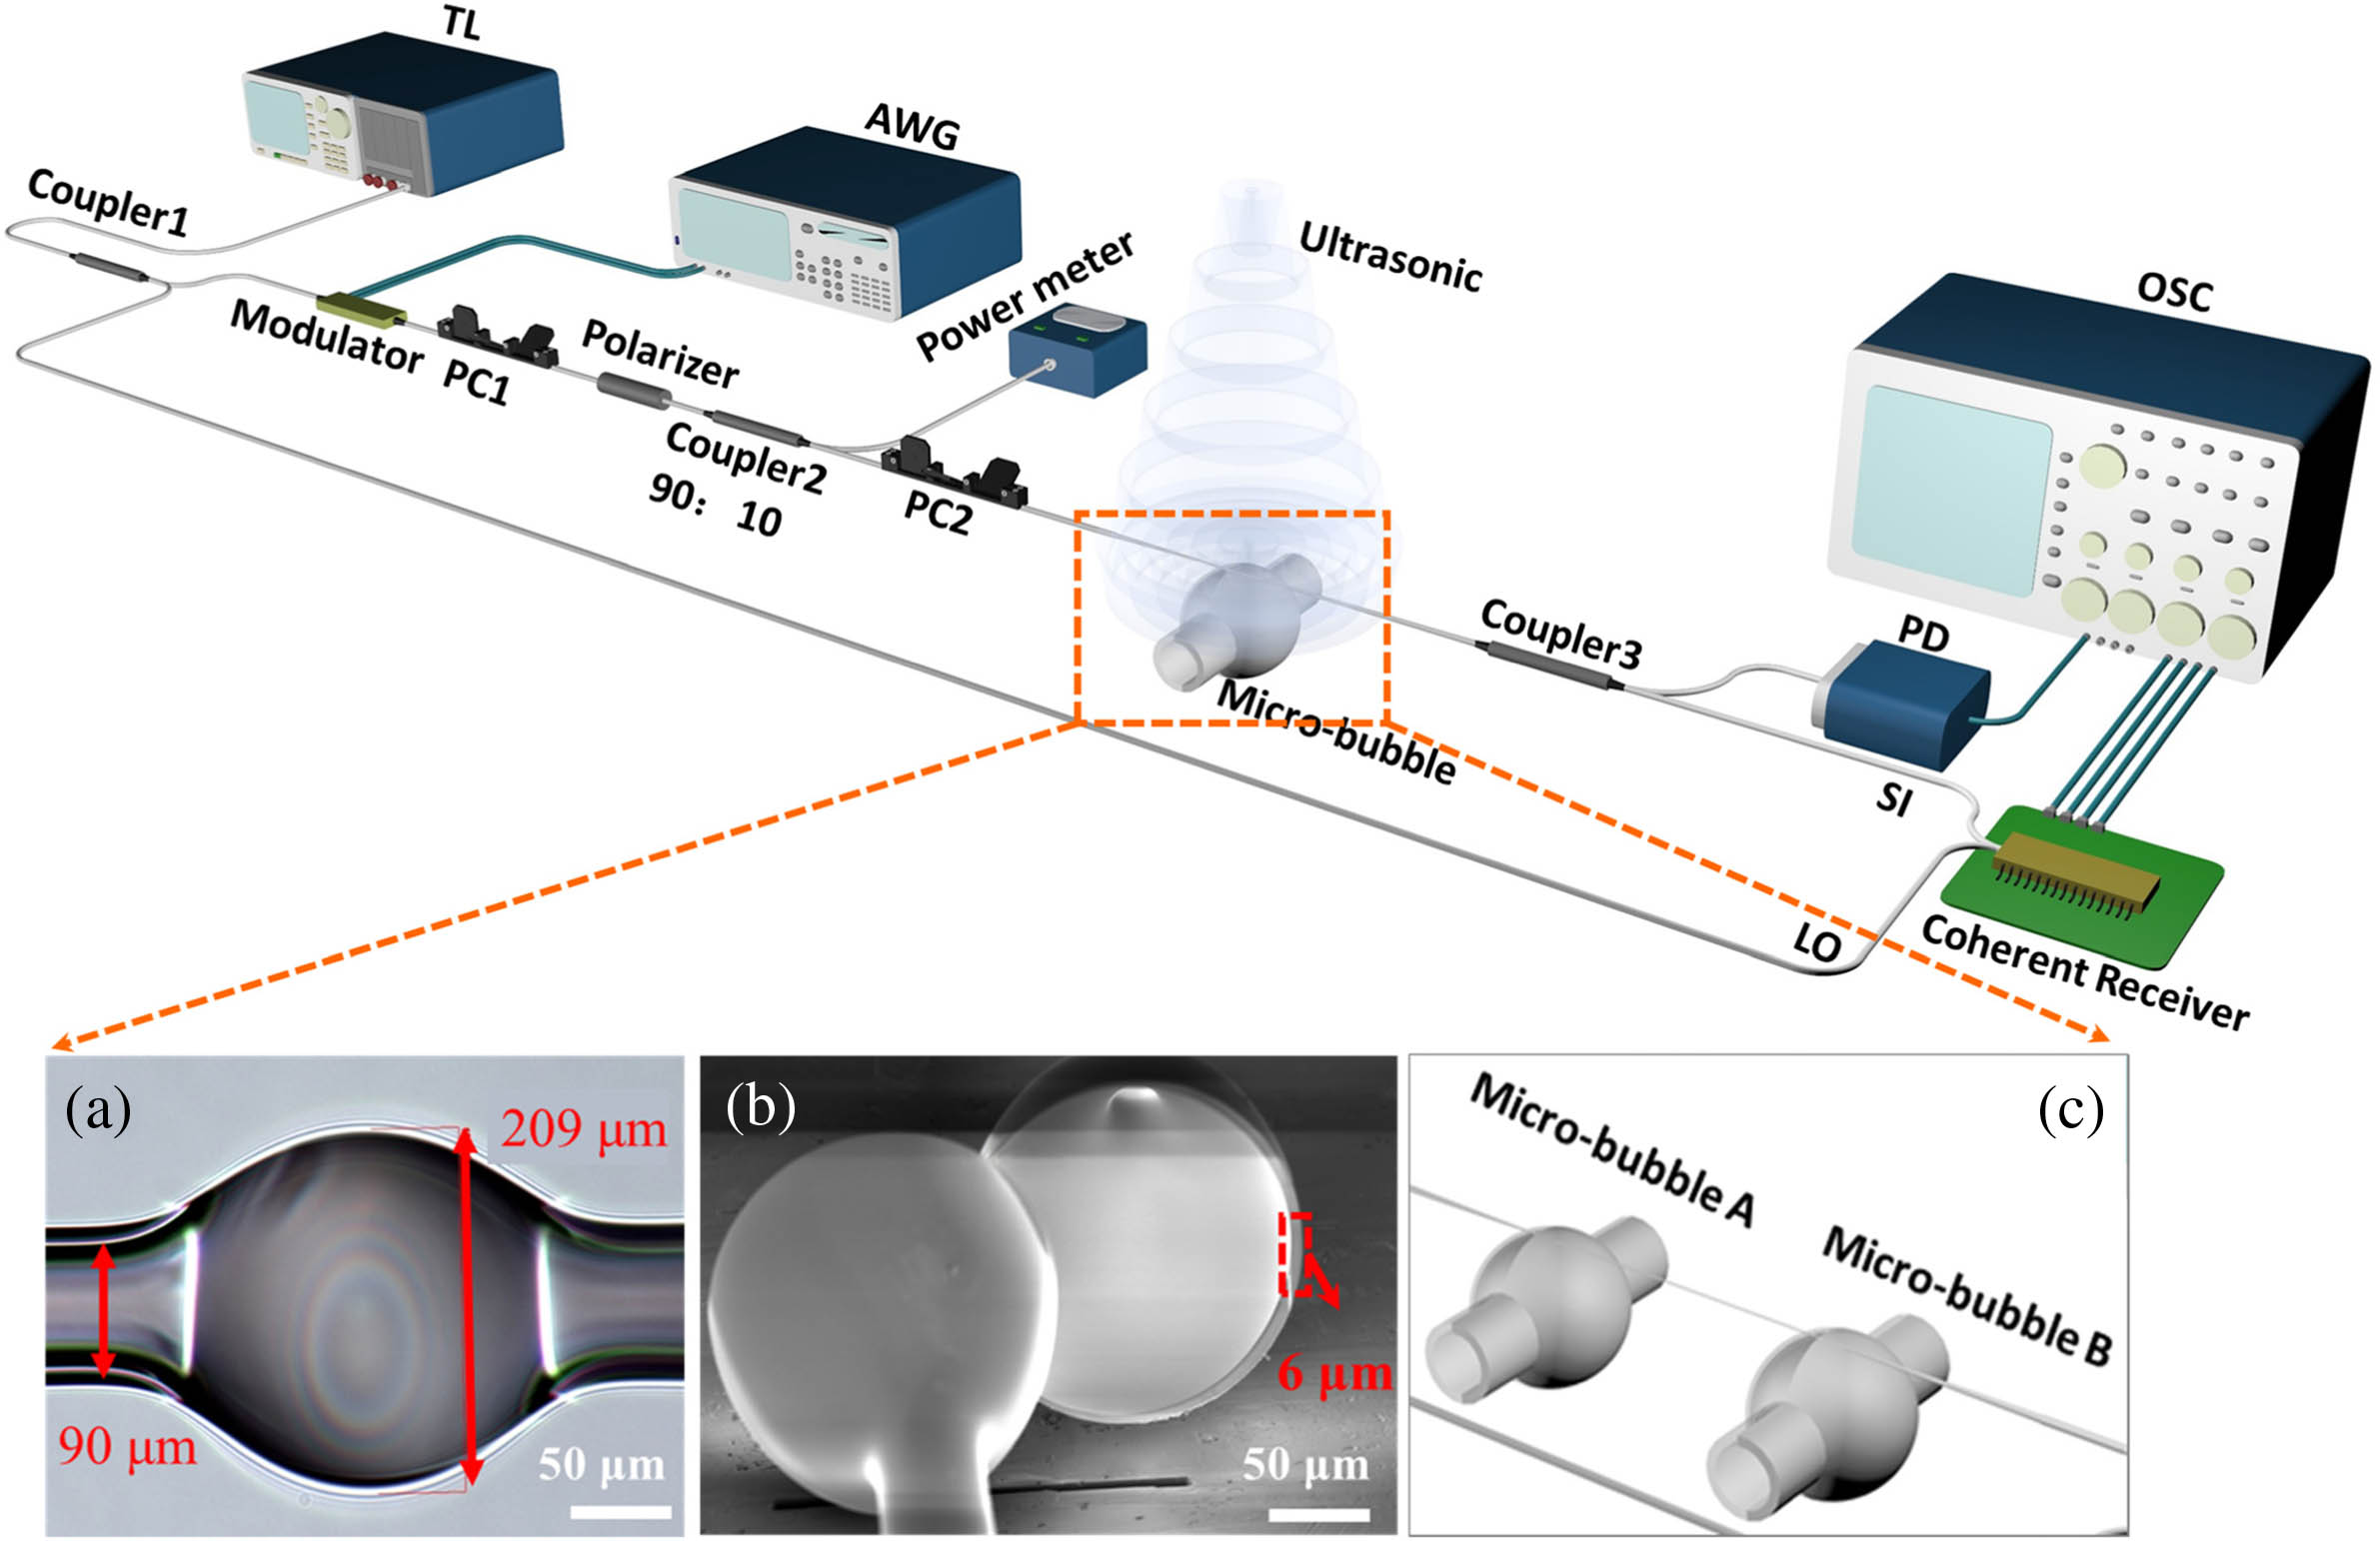
    Fig. 1. Schematic of the experimental setup combining an MBR with the DOFC technique. TL, tunable laser; PC, polarization controller; AWG, arbitrary waveform generator; PD, photodetector; OSC, oscilloscope; SI, signal input; LO, local oscillator. (a) Microscopic image of the MBR with a diameter of 209 μm. (b) SEM image of the cross section of the MBR. (c) Schematic of the ultrasound detection using two MBRs.
    Schematic of the experiments based on (a) TL frequency-tuning and (b) DOFC methods. (c) The transmission spectrum using TL scanning. (d) Resonant dip in the transmission spectrum using TL scanning, and the Q factor is estimated as 3.02×10⁷. (e) Resonant dip in the transmission spectrum using DOFC.
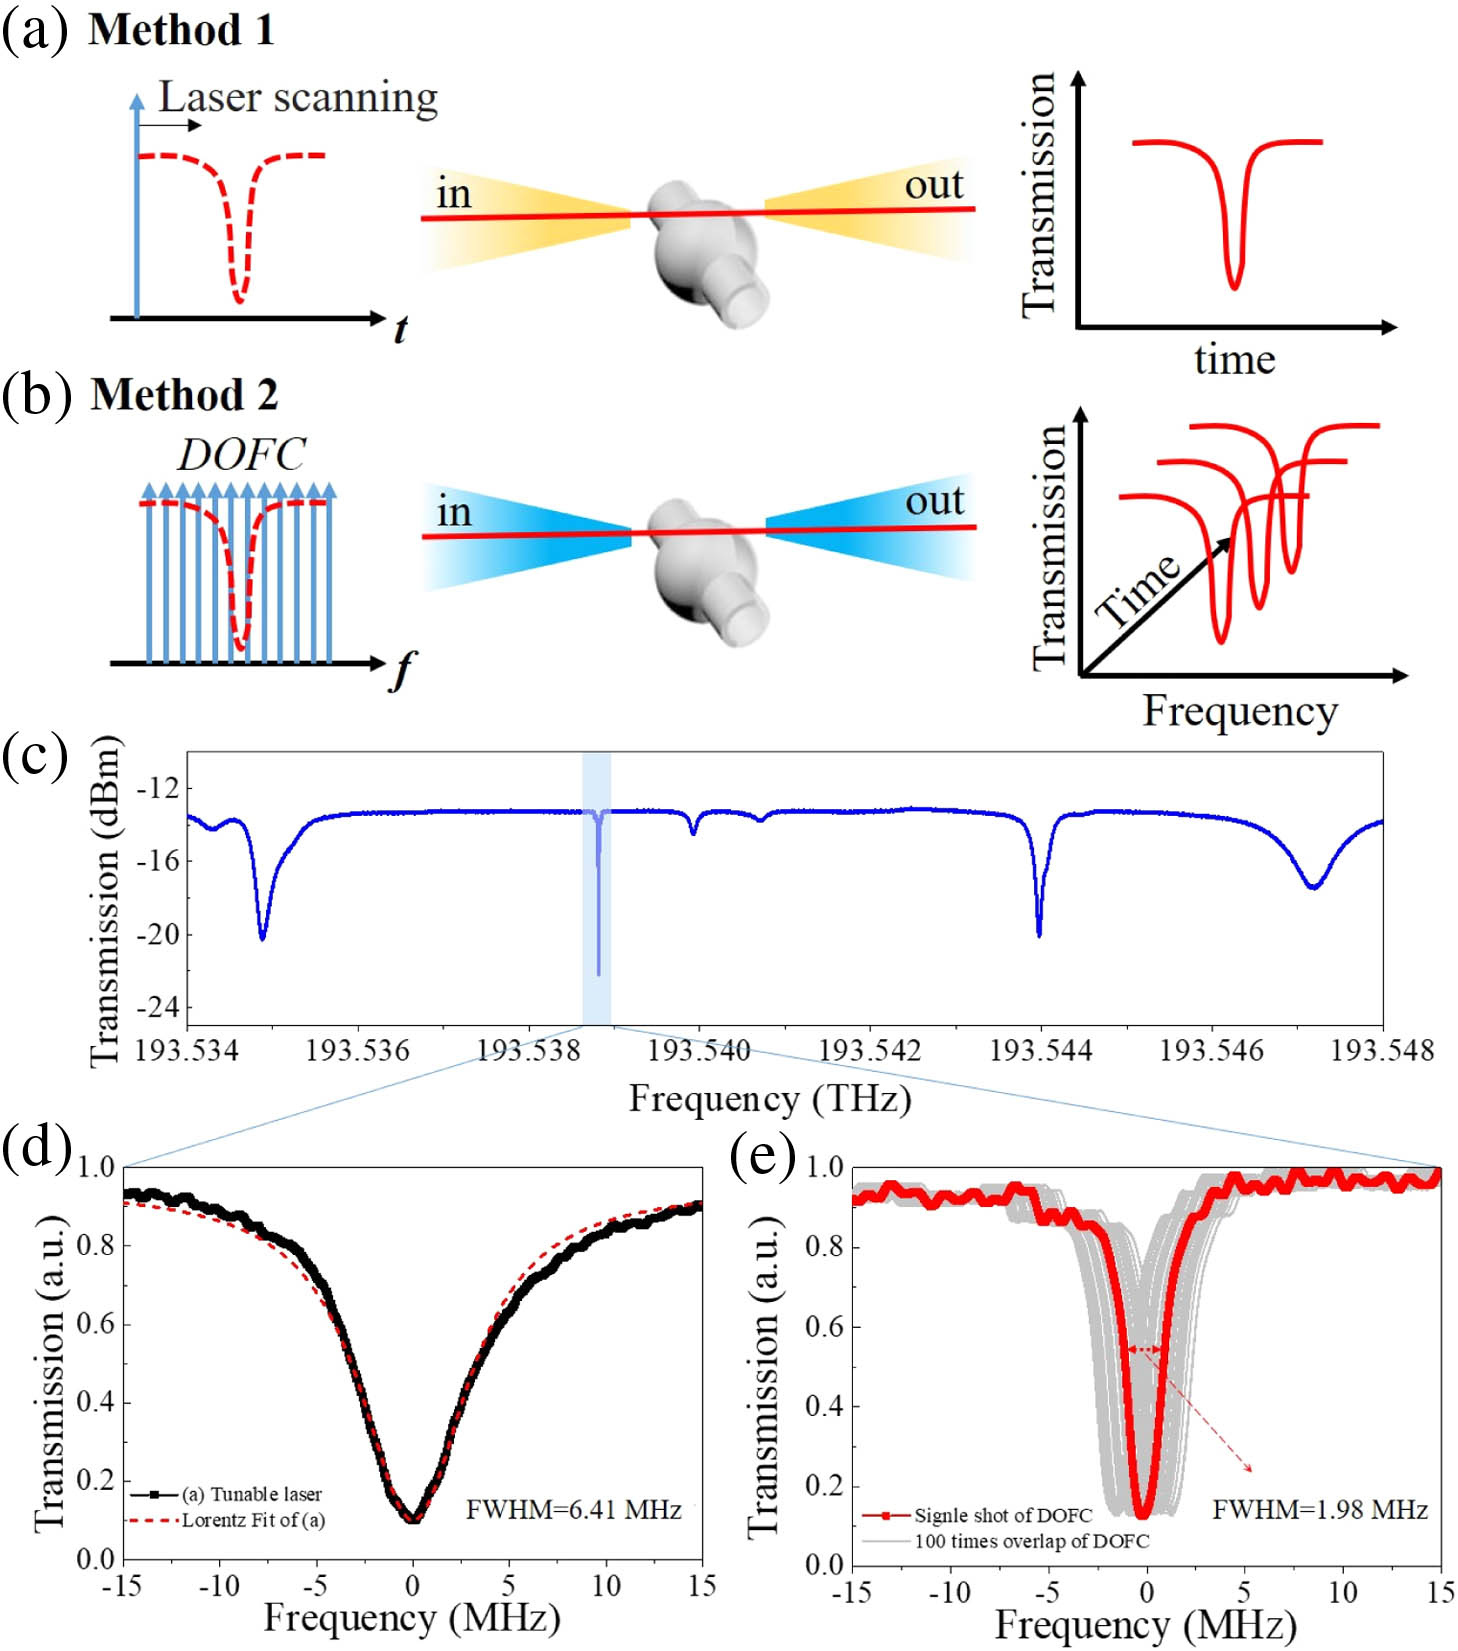
    Fig. 2. Schematic of the experiments based on (a) TL frequency-tuning and (b) DOFC methods. (c) The transmission spectrum using TL scanning. (d) Resonant dip in the transmission spectrum using TL scanning, and the Q factor is estimated as 3.02×10⁷. (e) Resonant dip in the transmission spectrum using DOFC.
    (a) Intensity and (b) phase responses in the MBR-based DOFC without ultrasonic stimulation. (c) Intensity and (d) phase responses in the MBR-based DOFC with ultrasonic stimulation. The insets on the right part of (a)–(d) are enlarged contour parts.
    Fig. 3. (a) Intensity and (b) phase responses in the MBR-based DOFC without ultrasonic stimulation. (c) Intensity and (d) phase responses in the MBR-based DOFC with ultrasonic stimulation. The insets on the right part of (a)–(d) are enlarged contour parts.
    (a) Frequency response of a resonance peak in a single ultrasound response period. (b) The retrieved frequency spectrum of point D obtained by FFT.
    Fig. 4. (a) Frequency response of a resonance peak in a single ultrasound response period. (b) The retrieved frequency spectrum of point D obtained by FFT.
    Measured transmission spectra of the temperature-induced frequency shifts of MBR-A and MBR-B.
    Fig. 5. Measured transmission spectra of the temperature-induced frequency shifts of MBR-A and MBR-B.
    (a) Schematic of an ultrasound detector based on two MBRs. (b) Frequency shift of the resonant peaks of MBR-A and MBR-B varies with time under the ultrasonic response. Δφ is the phase difference between the two resonators. (c) Relationship between the Δφ and the distance between the ultrasound and the MBR-A. (d) Schematic of a 3D structure testing model with an array of MBRs.
    Fig. 6. (a) Schematic of an ultrasound detector based on two MBRs. (b) Frequency shift of the resonant peaks of MBR-A and MBR-B varies with time under the ultrasonic response. Δφ is the phase difference between the two resonators. (c) Relationship between the Δφ and the distance between the ultrasound and the MBR-A. (d) Schematic of a 3D structure testing model with an array of MBRs.
     165 kHz40 kHz
    Experimental ResultABCDABCD
    τ (ms)0.30.30.30.30.30.30.30.3
    SNR (dB)121818218.8131417
    Papplied (Pa)a3.23.23.23.23.23.23.23.2
    P(mPa/Hz)136.96.74.82011107.2
    Table 1. NEP of Ultrasound Detectors Calculated Based on the SNR at Different Points at 40 kHz and 165 kHz
    Jingshun Pan, Bin Zhang, Zhengyong Liu, Jiaxin Zhao, Yuanhua Feng, Lei Wan, Zhaohui Li. Microbubble resonators combined with a digital optical frequency comb for high-precision air-coupled ultrasound detectors[J]. Photonics Research, 2020, 8(3): 303
    Download Citation