1Key Laboratory of Optoelectronic Materials and Technologies, School of Electrical and Information Technology, Sun Yat-sen University, Guangzhou 510275, China
2Southern Marine Science and Engineering Guangdong Laboratory (Zhuhai), Zhuhai 519000, China
3Department of Electronic Engineering, College of Information Science and Technology, Jinan University, Guangzhou 510632, China
Jingshun Pan, Bin Zhang, Zhengyong Liu, Jiaxin Zhao, Yuanhua Feng, Lei Wan, Zhaohui Li, "Microbubble resonators combined with a digital optical frequency comb for high-precision air-coupled ultrasound detectors," Photonics Res. 8, 303 (2020)
Copy Citation Text
Fast and sensitive air-coupled ultrasound detection is essential for many applications such as radar, ultrasound imaging, and defect detection. Here we present a novel approach based on a digital optical frequency comb (DOFC) technique combined with high- optical microbubble resonators (MBRs). DOFC enables precise spectroscopy on resonators that can trace the ultrasound pressure with its resonant frequency shift with femtometer resolution and sub-microsecond response time. The noise equivalent pressure of air-coupled ultrasound as low as is achieved by combining a high- (~) MBR with the DOFC method. Moreover, it can observe multi-resonance peaks from multiple MBRs to directly monitor the precise spatial location of the ultrasonic source. This approach has a potential to be applied in 3D air-coupled photoacoustic and ultrasonic imaging.
1. INTRODUCTION
High-precision ultrasound detection has long been investigated and widely utilized for non-invasive examination in defense, biomedical, and industrial engineering applications such as aerospace, photoacoustic tomography, ultrasound imaging, and interface detection [1–5]. In extreme environments (e.g., imaging of sensitive wounds or dangerous specimens, bond inspection, functional ophthalmology imaging) or unfavorable environments (e.g., stray electromagnetic fields, in restricted spaces, forced dry environment), the use of a contact-free ultrasound detection is desirable. State-of-the-art ultrasound detectors based on piezoelectric materials usually require an ultrasound impedance matching layer (such as water, gel, or solid) between the sample and the detector, due to large acoustic coupling loss at the sample/air and detector/air interface and high ultrasound absorption of air [6,7]. Currently, optical acoustic sensors (OASs) are promising candidates to promote biomedical and industrial ultrasound detection techniques, compared with those based on conventional piezoelectric transducers (PZTs), due to their immunity to geometry-dependent electrical noise and electromagnetic interference [1,7,8]. Typically, the fundamental concept of the most exciting OASs is that an optical medium transforms an ultrasound wave into the changes of optical resonance in terms of intensity, phase, or frequency, which can be easily detected by a photodetector (PD) [1–3,5,9,10]. However, to date, there are still challenges in observing a faithful representation of the incident contact-free acoustic wave and ultimately maintaining image fidelity [3,6]. For example, the intensity of air-coupled pressure waves is significantly reduced by acoustic coupling loss and the acoustic absorption, which makes it difficult to achieve high sensitivity. Usually, the intensity detection scheme with analog signal will be limited fundamentally by the low photoelectric conversion efficiency. An additional problem for phase observation is that the phase should be encoded into intensity signal, which limits sensitivity against surrounding noise [11]. Therefore, there are two factors that determine the sensitivity of OASs: (1) the conversion efficiency of the sound pressure to optical changes, which depends upon the sensitivity performance of the optical detector to ultrasound [9], (2) the accuracy and fast optical spectral measurement, which have a trade-off between resolution and speed [12–15].
Whispering-gallery mode (WGM) microresonators have emerged as a highly sensitive platform for optical sensing applications due to their ultra-high quality () factor and small mode volume, which leads to significantly enhanced light–matter interactions [1,3,9,16–20]. Therefore, the mechanical vibrations induced by ultrasound pressure can be converted into changes in optical properties of the resonator, particularly into the change of cavity resonance, including linewidth broadening (owing to shortening of the cavity lifetime) [21,22], resonance splitting (caused by the crosstalk between its two counter-propagating modes) [16,23], and resonant frequency shift (induced by modification of the optical path) [5,7,24,25]. Therefore, a high-quality WGM microresonator can enhance the optical response to ultrasound, leading to highly sensitive detection [26,27]. Then the remaining question is to perform high-resolution and fast optical spectroscopy to capture ultra-fine spectral changes of the high- cavity resonance.
Currently, there are methods to quickly and separately measure the changes of WGM modes by monitoring the output optical frequency or phase changes of a fixed wavelength via a high-speed PD. Typically, all these optical variations are in the scale of a few megahertz (MHz) and microseconds (μs) [13]. Therefore, the need for active stabilization of pump light or temperature is necessary, which is challenging to implement, requiring a customized pump power time dependence. Furthermore, there is a fundamental limit of the PD-related detection scheme for obtaining the full spectrum, and it is difficult to distinguish the real cause of these optical characteristics such as the power change and mode splitting, linewidth broadening, or frequency shift [28]. Based on these approaches, 3D imaging, such as ultrasound imaging and photoacoustic tomography by detecting an array of WGM resonators, also requires an array of PDs, making the system overall complex, cumbersome, and expensive. Nevertheless, it is preferable to quickly obtain a complete optical spectrum containing multiple resonances with several microresonators. Conventionally, the laser frequency-tuning method is used for mapping a full spectrum of cavity resonances. However, it is inherently slow since the laser-tuning time must be much longer than the photon lifetime to access the steady state of the cavity resonance [13]. In contrast, optical frequency combs (OFCs) can provide the broadband optical mode spectrum of microresonators by direct spectroscopy. Compared with the laser-tuning method, OFC-based spectroscopy is noise robust, fast, and highly sensitive, and it is therefore suitable for ultrasound detection. In our previous work [12], we reported a technique to generate ultra-fine OFC in a digital way and employed it as a frequency ruler for spectroscopy, achieving a spectral resolution of 0.01 pm and a response time of 1 μs. This technique, if associated with a high- microresonator as the ultrasonic detector, would be promising to capture ultrasound signals with high sensitivity.
Sign up for Photonics Research TOC. Get the latest issue of Photonics Research delivered right to you!Sign up now
Here we report a fast and sensitive air-coupled ultrasound detection by using a high- microbubble resonator (MBR) combined with a modified digital optical frequency comb (DOFC). The hollow structure of the MBR with an ultrathin wall will enhance the sensitivity of the ultrasound detection. The DOFC is generated by an advanced digital signal processing (DSP) technique, and its comb spacing and bandwidth range can be adjusted digitally. It has a spectral resolution of the femtometer (fm) scale and a sub-microsecond (μs) response time scale when it is set to have a comb spacing range of 10 kHz–20 MHz and a bandwidth range of 100 MHz–40 GHz [29]. Such an ultra-fine comb spacing enables direct spectroscopy on microresonators and can capture a full mode spectrum at a single time point (like a snapshot, not by scanning) in the μs time range [12]. In the experiments, we provide a proof-of-concept demonstration of accurate detection of ultrasound generated by a PZT using the method combining an MBR with a high of with the DOFC. Noise equivalent pressure of air-coupled ultrasound at 165 kHz as low as is achieved using this method. Moreover, the distance dependency of our scheme also allows for positioning the acoustic source by monitoring the relationship of phase changes with the distance between the PZT and the two MBRs. It can form a 3D spatial structure model for imaging if an array of MBRs is used, which paves a promising way for high-precision air-coupled ultrasound tomography.
2. EXPERIMENT
A. Fabrication of Microbubbles
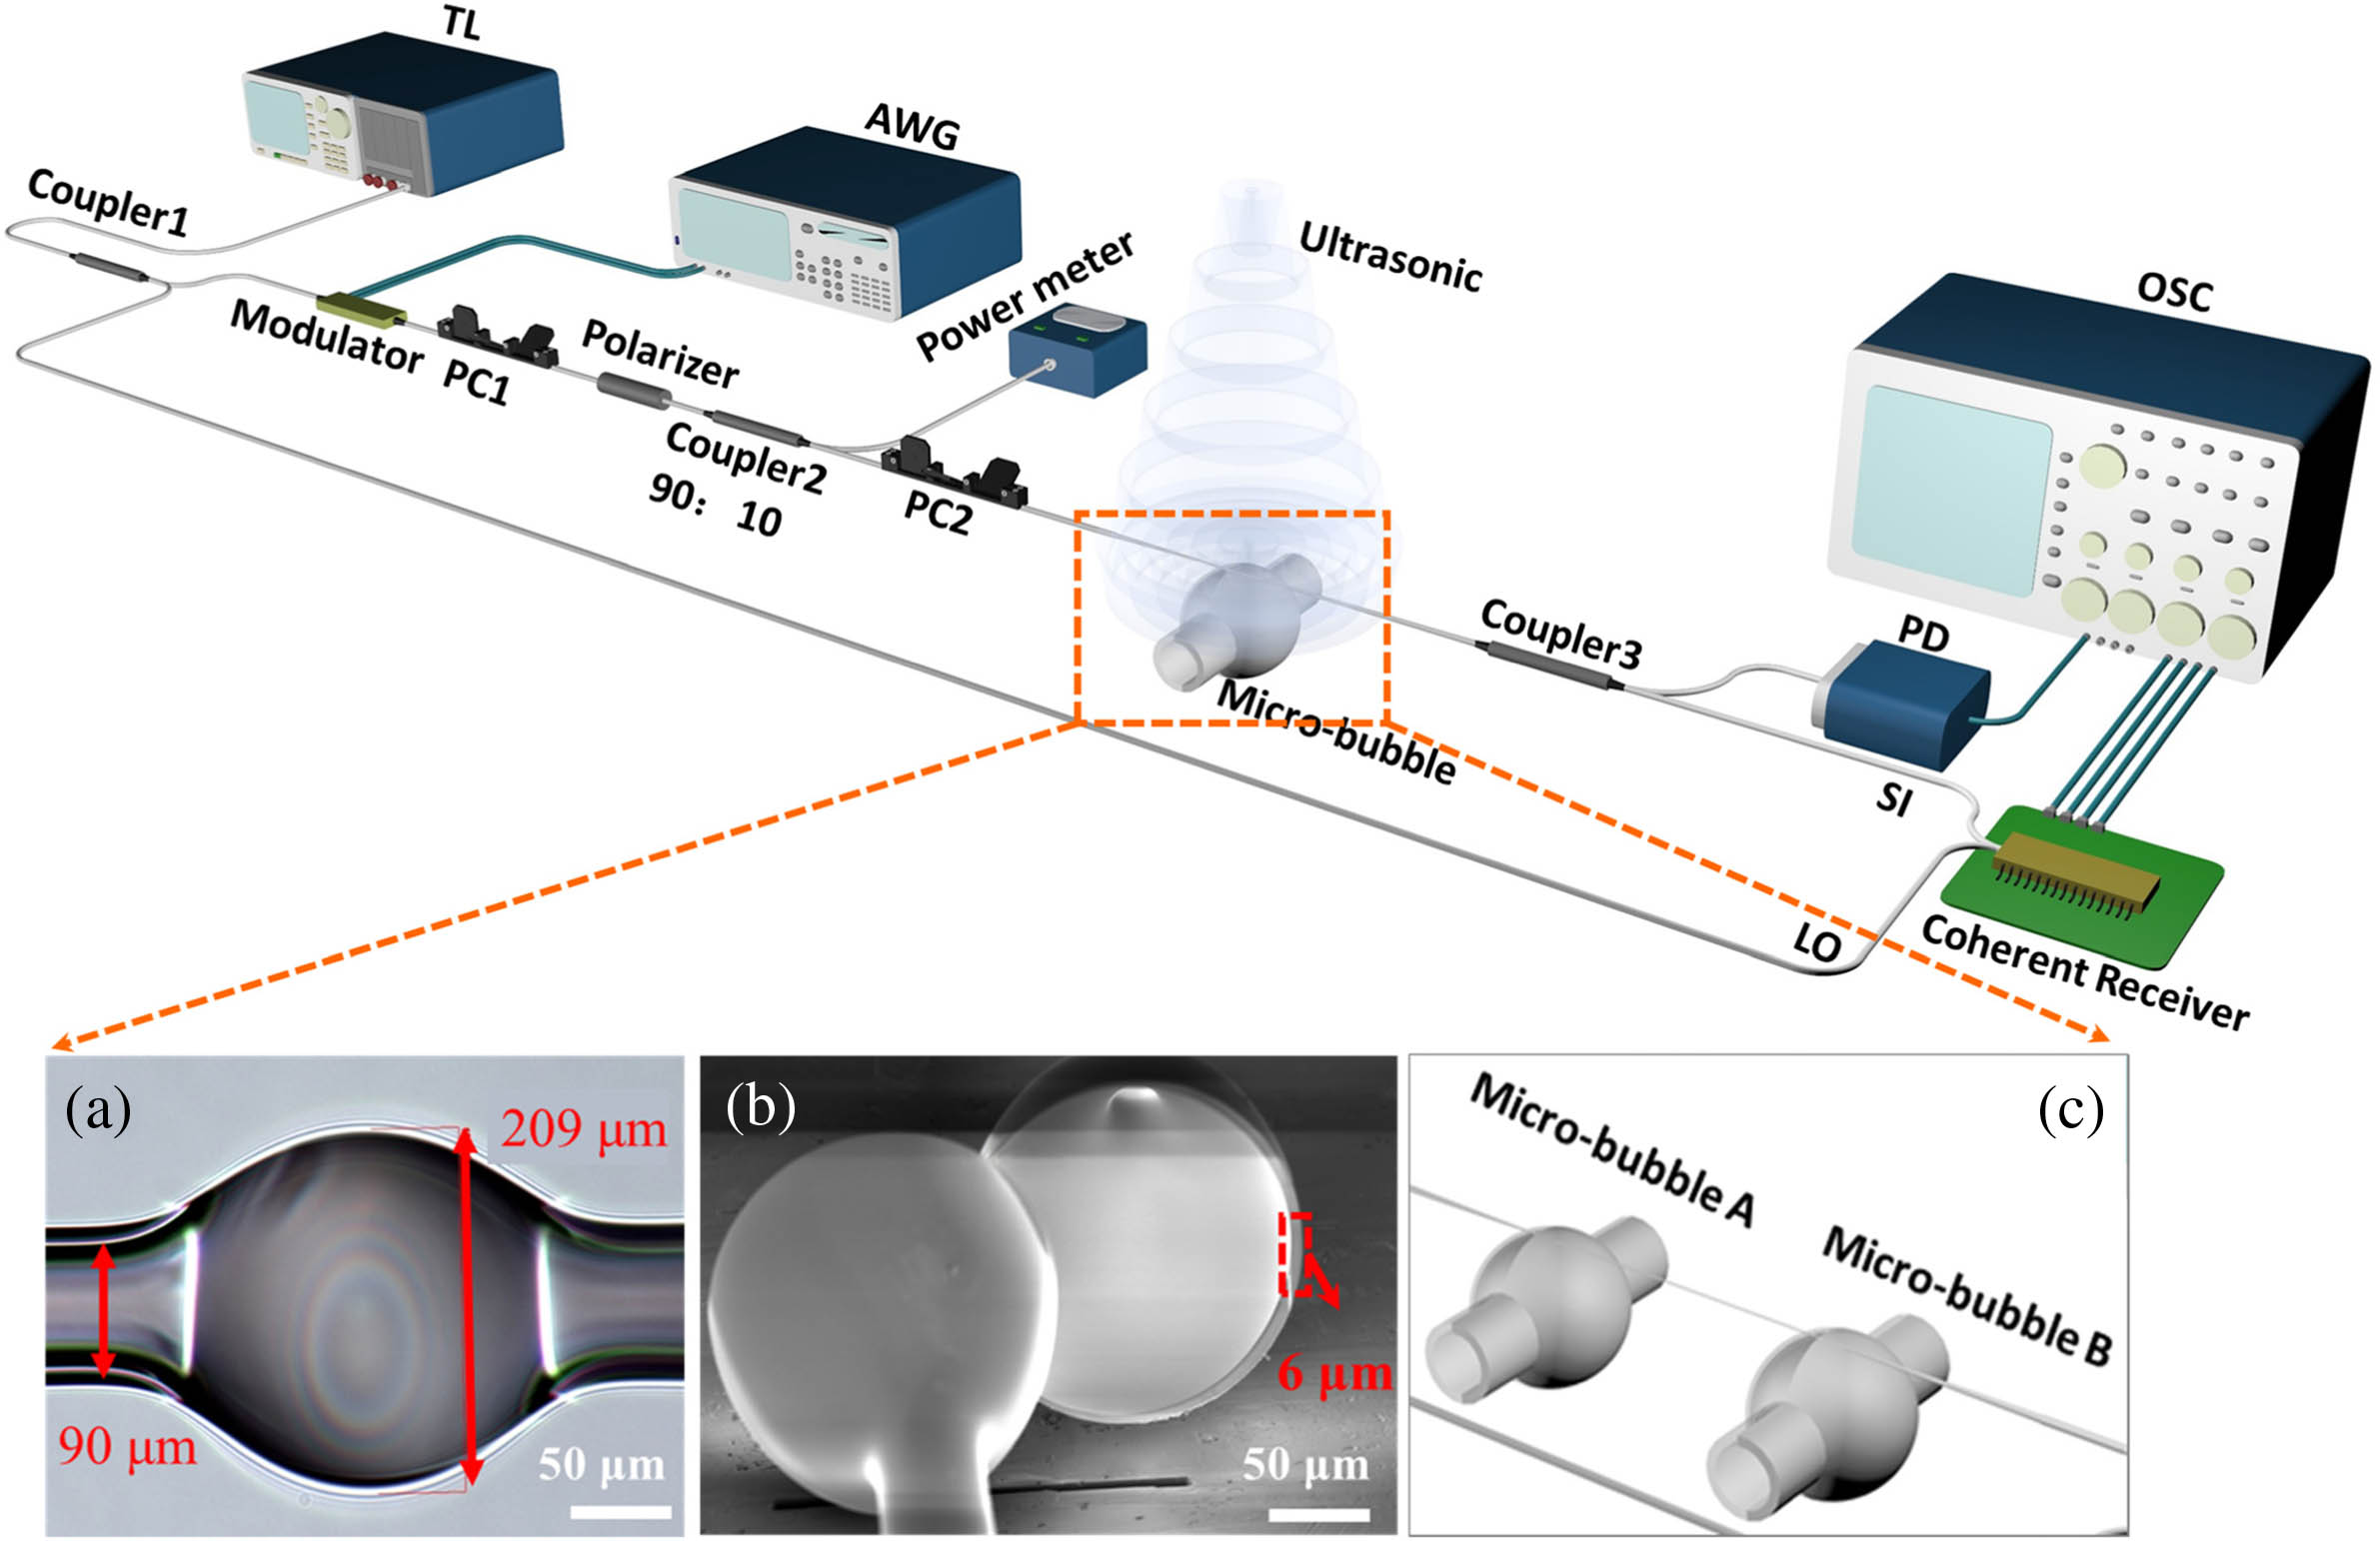
An MBR is fabricated based on a hollow silica capillary with an inner diameter of 60 μm and an outer diameter of 90 μm, which is drawn carefully via a fiber draw tower. First, one end of the capillary is sealed using an arc discharge. The other end of the capillary is then connected to an air pump. Assisted by the air pressure inside the capillary, the outer wall expands to form a microbubble at the position of heating by arc discharge [30]. Multiple microbubbles can be prepared by changing the heating zone of the capillary, which is easy for mass production. The outer diameter of the microbubble can be precisely controlled by carefully adjusting the gas pressure and the arc discharge. Figure 1(a) shows the image of one fabricated microbubble. One microbubble is cleaved carefully using a focused ion beam (FIB) to observe its cross section. The scanning electron microscope (SEM) image is shown in Fig. 1(b), indicating a diameter of 209 μm and a wall thickness of μ.
Figure 1.Schematic of the experimental setup combining an MBR with the DOFC technique. TL, tunable laser; PC, polarization controller; AWG, arbitrary waveform generator; PD, photodetector; OSC, oscilloscope; SI, signal input; LO, local oscillator. (a) Microscopic image of the MBR with a diameter of 209 μm. (b) SEM image of the cross section of the MBR. (c) Schematic of the ultrasound detection using two MBRs.
For experimental demonstration, the scheme including MBR integrated with DOFC for ultrasound detection is shown in Fig. 1. A PZT is used as ultrasonic generator, creating an ultrasonic wave to stimulate the resonance of MBR. A tunable laser [TL, center wavelength at 1550 nm and linewidth of 10 kHz (Keysight 81606A)] is used as the input signal of the system and is split into two branches by a 50:50 coupler. For DOFC spectral measurement, one part of the signal is directly connected to the coherent receiver as the local oscillation signal. The other one passes through an electro-optic (E/O) modulator, which is driven by an electro-frequency comb signal generated by an arbitrary waveform generator (AWG, sampling rate up to 60 GS/s) to generate a DOFC signal. The comb spacing and the bandwidth are both tunable when using our AWG to generate a frequency comb. Then the DOFC signal goes through a polarization controller (PC) used for adjusting the polarization state, and then it is coupled into the microbubble through a tapered fiber. Finally, the signal enters the coherent receiver (with a bandwidth of 40 GHz) and combines with the local oscillator (LO) for coherent detection. The output of the coherent receiver is sampled by a real-time oscilloscope (OSC, sampling rate up to 80 GS/s), which feeds the data into a computer to compute the optical spectrum (including intensity and phase) using an FFT-based channel estimation algorithm. For laser frequency-tuning method, the signal in the branch having E/O will sweep the MBR to find the selected same mode when the AWG is switched off. In the process, the power and polarization of the light will be the same as those of DOFC method. The coupling conditions of the fiber taper and MBR are kept identical in both methods. (Actually, the fiber taper and the MBR are close together and are not moved in both methods.) We select a mode that has ultranarrow linewidth [in Fig. 2(c)] and is highly separate from others to monitor the change in its resonant frequency as the response to the acoustic stimulation. This mode has no crosstalk with other higher-order modes. We trace the acoustic source at two different frequencies, namely, 40 kHz and 165 kHz.
Figure 2.Schematic of the experiments based on (a) TL frequency-tuning and (b) DOFC methods. (c) The transmission spectrum using TL scanning. (d) Resonant dip in the transmission spectrum using TL scanning, and the factor is estimated as . (e) Resonant dip in the transmission spectrum using DOFC.
A. Operational Principle of Optical Ultrasound Sensing Based on MBR and DOFC
Basically, a high- MBR works as an ultrasonic wave receiver and can be mechanically affected by the mechanical pressure induced by the ultrasound. It can transduce the ultrasonic wave to optical changes in intensity and phase, which can be achieved by the DOFC spectral measurement with high resolution and fast response. Thus, the approach combining the MBR and DOFC is capable of acquiring a full spectrum containing the intensity and phase domain, which has a high SNR of more than 20 dB [later shown in Fig. 4(c)]. It is a noise-robust and sensitive method, achieving reliable and highly precise detection of acoustic waves. When switching off the ultrasonic source, the resonance frequency is expressed by where is the resonant frequency of the micro-cavity; is the speed of light in vacuum (or in the silica); is the mode number of resonances expressed as 1, 2, 3…; and is the effective refractive index of the WGM in the micro-cavity. is the circumference of the micro-cavity. When switching on the ultrasound source, the periodic mechanical vibrations will be introduced by resonant signals of the ultrasound and interact with the surface of the micro-cavity through the air. The ultrasonic stimulation will cause periodic deformation of the radius of MBR and thus result in spectral changes of the MBR. The corresponding shift in the resonant frequency of the selected mode results from the photoelastic effect and the geometric deformation, which can be derived as [7] where is the shift in the resonant frequency of the selected mode, and and are the geometric deformation and the photoelastic effect [7] of the micro-cavity, respectively. Additionally, the mechanical noise is introduced by collisions with gas molecules surrounding the resonator, e.g., the viscosity of the gas and optical measurement noise, which accounts for the optical and mechanical response of the sensor as a function of acoustic drive frequency and cavity deformation [3]. For the MBR structure case, we can derive that pressure sensitivity can be improved remarkably by using a thinner-walled MBR with larger radius and higher factor according to Ref. [7]. Therefore, a scheme combining an MBR having an ultrathin wall and high with DOFC having high resolution, high speed, and full-spectrum acquisition is promising to improve the sensitivity of ultrasound detection.
B. Characterization of the High Resolution, High Speed, and Full-Spectrum Acquisition of the Approach Combining High- MBR with DOFC
To characterize the spectral resolution, we test the transmission spectra of the same MBR by using a TL frequency-tuning method and the DOFC method for comparison. For measuring a resonance that is on the level of MHz, the DOFC is set to have a bandwidth of 5 GHz and a comb spacing of 20 kHz. The schematics of the TL frequency-tuning method and DOFC method are shown in Figs. 2(a) and 2(b), respectively. By TL frequency-tuning method, the linewidth of the selected MBR resonance is measured to be 6.41 MHz, corresponding to a factor of ; see Fig. 2(d). When switching to the DOFC method, each shot of the comb (i.e., one temporal period of the DSP-modulated laser) will execute instantaneous broadband spectroscopy on the resonance, within a time as short as dozens of μs. Therefore, the resonance is captured shot by shot by the DOFC, and all the snapshots can be recorded in line with periods. Figure 2(e) shows one shot of the selected resonance, together with an overlap of 100 snapshots, which will make the DOFC method comparable in measurement time to the laser-tuning method. We notice that the measured linewidth of the 100 snapshots is always constant, e.g., 1.98 MHz as shown in Fig. 2(e), while its frequency is drifting within a range of several MHz [3] [cf. the overlapped shots in Fig. 2(e)]. Therefore, these results show we can use the DOFC method for observing a full spectrum of cavity resonance in a μs time level with a resolution comparable to TL-tuning method. A physical picture of the narrow-linewidth signal by the DOFC method is still not clear, and we are still working on the DOFC method to obtain a better understanding.
The advantages of the scheme combining a high--factor MBR and a DOFC enable us to detect ultrasonic vibration by monitoring the spectral changes in the resonant frequency of the selected mode. A PZT operating at 165 kHz is chosen as the ultrasound source and is positioned vertically above the MBR. The distance between the PZT and the MBR is set at 2 cm to build the coupling setup. To measure the shift in the resonant frequency of MBR when switching on the acoustic source, the DOFC is set to have a comb spacing of 1.22 MHz and a bandwidth of 5 GHz. The resolution is enough to test the frequency shift of the resonant peak under ultrasonic stimulation. Therefore, the corresponding time of each comb is μ, namely, the scanning speed is 48,000 nm/s. The scanning speed of the DOFC will be up to 390,000 nm/s when the bandwidth increases to 40 GHz [29]. It is 1950 times faster than that of the TL frequency-tuning method, even when the maximum scanning speed of 200 nm/s is used. Moreover, the intensity and phase information of the selected resonant peaks of MBR in a 5 GHz bandwidth can be obtained by demodulating the DOFC data. As shown in Figs. 3(a) and 3(b), no changes were observed in the intensity and phase spectra when switching off the ultrasonic vibration. In contrast, periodic frequency shifts were observed in both intensity and phase spectra. The detailed changes of the shift in the resonant frequency of the selected mode with time are shown in the insets of Fig. 3.
Figure 3.(a) Intensity and (b) phase responses in the MBR-based DOFC without ultrasonic stimulation. (c) Intensity and (d) phase responses in the MBR-based DOFC with ultrasonic stimulation. The insets on the right part of (a)–(d) are enlarged contour parts.
The oscillation frequency of 165 kHz is observed by the FFT analysis of the intensity and phase data in Figs. 3(c) and 3(d), which is consistent with the actual frequency of ultrasonic stimulation. The results calculated from the intensity and phase domain are similar. Thus, the following analysis mainly uses intensity data. When the acoustic source is switched off, we set the MBR to be close to the critical coupling regime. However, when the acoustic source is on, deformation of the MBR will shift the coupling between the resonator and the tapered fiber, such that the critical coupling regime is altered. Moreover, the changes of the effective refractive index of the MBR are also caused by the acoustic source, which results in the tiny changes of the dip depth. With the above, the DOFC method can easily capture the resonant peak and realize fast detection. Moreover, high-speed detection is beneficial to decrease the influence of temperature and environment noise on the frequency shift of the resonant peak.
In order to verify the superiority of the DOFC method in full-spectrum acquisition, we analyze the variation of frequency shift in the 32 MHz range within 250 μs and select four points in the same way as the frequency-locking method to compare the accuracy as shown in Fig. 4(a). The result shows a clearly periodic frequency shift of the resonance peak in response to the ultrasound stimulation. We test the power changes at frequencies of , , , and at the resonance peaks, marked as positions A, B, C, and D, respectively. Among them, point A is located at the minimum slope of the resonant dip, point C is located at the maximum slope of the resonant dip, and point B is located between point A and point C [7,31]. We also monitor the time-varying curve of the resonant dip frequency offset from the curves of spectrum versus time, named the D line. It shows the value of frequency shift rather than the change of power as shown in the blue area in Fig. 4(a). As shown in Fig. 4(b), by conducting the FFT of their time-domain curves, it can be concluded that there is a frequency response at 165 kHz (illustrations in the corner of each image), which is consistent with the driving frequency of the PZT. The SNRs of points A, B, and C at the response peaks are 12.3, 18, and 18.3 dB, respectively, using the same processing method when the monitored wavelengths were fixed at points C, B, and A, respectively, as shown in Table 1. The applied pressure value was assumed to be 3.2 Pa according to the value inferred from previous experiments in Ref. [7]. The average time () is set to 0.3 ms uniformly. According to the formula [3], we achieve the noise-equivalent pressures (NEPs) of points A–D at the response peak. As shown in Table 1, they are , , , and at 165 kHz, respectively. We use a similar test device and setup as in Ref. [7] to measure the relation of the driving voltage of the PZT (165 kHz) and pressure on the MBR. Peak-to-peak pressure values at the resonator in air as a function of the peak-to-peak value of driving voltage can be obtained. With the above, we can easily set the driving voltage to the pressure value of 3.2 Pa. Therefore, we can adjust the driving voltage to set the similar pressure of 3.2 Pa when the distance between the PZT and microbubble is 2 cm. Additionally, the NEPs of points A–D at 40 kHz can be achieved accordingly, as shown in Table 1, and they are larger than those at 165 kHz and consistent with the inferred results from Refs. [1,7]. It can be concluded that the measured NEPs of points A–C are unreliable without the feedback and higher than those of point D (corresponding to the shift in the resonant frequency of the selected mode of the MBR). In contrast, based on the DOFC method, it could obtain the complete spectral snapshots of the resonator peaks of the MBR. It demonstrated that our scheme to sense the sound pressure on the MBR could meet the requirements of ultrasound detection by tracing the resonant frequency. As a result, we can detect the distance-related acoustic source [1,12,13].
Figure 4.(a) Frequency response of a resonance peak in a single ultrasound response period. (b) The retrieved frequency spectrum of point D obtained by FFT.
Using the detection method described above, we can also detect multiple MBR peaks in one spectral snapshot at the same time. To demonstrate this idea, we placed two MBRs together, 7.1 cm from each other on the tapered fiber, as shown in Fig. 1(c). First, the resonant dips of the MBRs are not affected mutually, which is illustrated in Fig. 5. The distance between MBR-A and a soldering iron tip is 10 cm; the tip is placed directly above MBR-A. There are two resonance peaks at 1550.0462 nm (Peak A) and 1550.0547 nm (Peak B) corresponding to MBR-A and MBR-B, respectively. When the temperature increases from 25°C to 30°C, Peak A will shift from 1550.0462 to 1550.0533 nm, while Peak B will not shift. It can be confirmed that the multi-peaks belong to different MBRs and are not affected mutually.
Figure 5.Measured transmission spectra of the temperature-induced frequency shifts of MBR-A and MBR-B.
To further illustrate the highly accurate positioning capability of our approach, the acoustic source is located by monitoring the relative phase changes () in the traces between the two MBRs. In the experiment, the bandwidth of the DOFC is set to 10 GHz, in which two selected modes attributed to different MBRs can be observed. As shown in Fig. 6(a), a PZT is initially placed at 70 cm directly above MBR-A and gradually descends vertically with a step of 5 cm, eventually stopping at 2 cm from MBR-A. “” stands for the distance between the PZT and MBR-A. “d1” stands for the distance between the final position of the PZT and MBR-A (2 cm in this experiment). “d2” is the distance between the PZT and MBR-B. As shown in Fig. 6(b), the value of of their respective resonance peaks would also be changed from 0.1 to 3.79 rad. The change of distance between the PZT and MBR-A can be calculated by the trigonometric function method [32]. Figure 6(c) shows the relationship between and the distance of the PZT and MBR-A by averaging over 100 experimental samples, which is in good agreement with the theoretical simulations. Using this method, we can describe the finer profile of the ultrasonic source with more MBRs around the ultrasound source by monitoring the spectral changes of the peaks from different MBRs. As shown in Fig. 6(d), we assume that if an array of MBRs can be placed on the flexible substrate, it can form a 3D spatial structure model for imaging, which is critical for ultrasound or photoacoustic imaging. This part of the work is currently under development and will be reported in our future work.
Figure 6.(a) Schematic of an ultrasound detector based on two MBRs. (b) Frequency shift of the resonant peaks of MBR-A and MBR-B varies with time under the ultrasonic response. is the phase difference between the two resonators. (c) Relationship between the and the distance between the ultrasound and the MBR-A. (d) Schematic of a 3D structure testing model with an array of MBRs.
Therefore, the scheme of MBRs combined with DOFC has three advantages in ultrasound detection. First, the scheme can provide high-resolution and high-speed snapshots of the spectral changes of the MBR, which can decrease the effect of thermal and mechanical noise from the surroundings. Second, the scheme shows good flexibility and scalability because the resolution, speed, and spectral region can be adjusted with the trade-off of the comb spacing and the bandwidth of the DOFC [12]. Additionally, the sensitivity of the scheme can be further improved by optimizing the material with a higher photoelastic effect, a thinner wall (ranging from sub-micrometer to μ), and higher factor [3,18]. The scheme could snapshot a full spectrum including multi-peaks from different MBRs, which has the potential to form a 3D spatial structure model for imaging if an array of MBRs is used, i.e., enabling photoacoustic imaging. In the future, the array pattern and the direction of the acoustic waves onto the MBR will be investigated.
4. SUMMARY
This work presents a facile and compact contact-free optical technique for ultrasound detection combining high- MBR with DOFC. It can acquire complete spectral snapshots of the resonator peaks of the MBR with femtometer resolution and sub-microsecond response time and thus enable us to capture ultrasound-induced spectral changes of the MBR including intensity and phase responses with time. Moreover, it can acquire multiple response peaks from multiple MBRs by using DOFC to determine the spatial location. For experimental illustration, we provide a demonstration of accurate detection of ultrasound generated by a transducer operating at 165 kHz by using an MBR combined with DOFC. Additionally, the precise localization of the ultrasound source has been demonstrated based on DOFC using multiple MBRs consistent with the theoretical calculation. The approach may be a potential tool for contactless air-coupled acoustic tomography imaging.
Acknowledgment
Acknowledgment. We thank Prof. Xuefeng Zhu and Dr. Pengqi Li at Huazhong University of Science and Technology for testing the data of pressure in air as a function of the driving voltage. We also thank Prof. Xuming Zhang at Hong Kong Polytechnic University and Prof. Hairun Guo at Shanghai University for discussing the results of MBRs using DOFC method.
Jingshun Pan, Bin Zhang, Zhengyong Liu, Jiaxin Zhao, Yuanhua Feng, Lei Wan, Zhaohui Li, "Microbubble resonators combined with a digital optical frequency comb for high-precision air-coupled ultrasound detectors," Photonics Res. 8, 303 (2020)