
Huawei Zhang, Wenjuan Jia, Jinlong Zhang, Panfeng Li. Image Restoration Algorithm Based on Quadratic Constraint and Haze Distribution[J]. Laser & Optoelectronics Progress, 2021, 58(22): 2228001
- Laser & Optoelectronics Progress
- Vol. 58, Issue 22, 2228001 (2021)
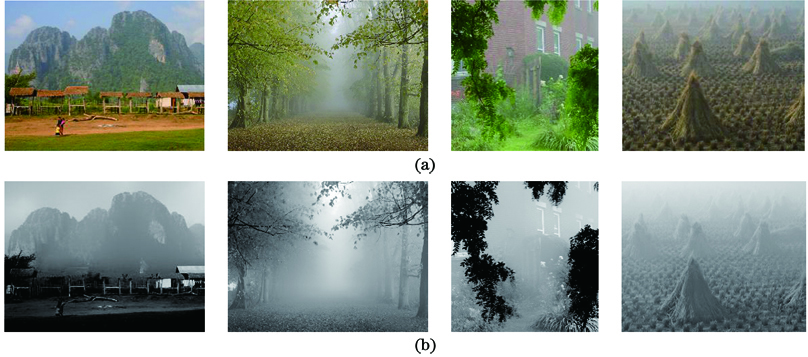
Fig. 1. Real hazy images and their haze distribution. (a) Hazy images; (b) hazy distribution maps
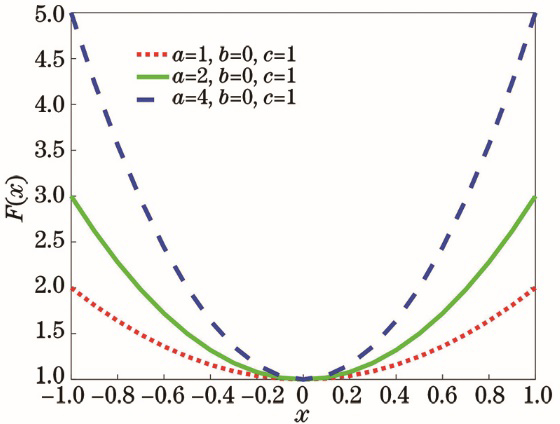
Fig. 2. Quadratic functions with different coefficients
Fig. 3. Comparison among minimum channels. (a) Hazy images in test set; (b) standard minimum channels in test set; (c) our minimum channels
Fig. 4. Transmittance comparison. (a) Hazy images; (b) method in Ref. [5]; (c) method in Ref. [7]; (d) our method
Fig. 5. Comparison between atmospheric light images as well as that between dehazing images. (a) Hazy image; (b) local atmospheric light image in Ref. [19]; (c) result in Ref. [19]; (d) atmospheric light image proposed here; (e) result proposed here
Fig. 6. Schematic of overall dehazing proposed here. (a) Hazy image; (b) minimum channel of hazy image; (c) minimum channel of clear image; (d) transmittance; (e) luminance component; (f) morphologically processed luminance component; (g) improved local atmospheric light; (h) restoration result
Fig. 7. Block diagram of proposed algorithm
Fig. 8. Restoration results of hazy images with sky areas. (a) Hazy images; (b) results by He et al; (c) results by Meng et al; (d) results by Yang et al; (e) results by Cai et al; (f) results by Ren et al; (g) our results
Fig. 9. Restoration results of hazy images without sky areas. (a) Hazy images; (b) results by He et al; (c) results by Meng et al; (d) results by Yang et al; (e) results by Cai et al; (f) results by Ren et al; (g) our results
Fig. 10. Comparison among restoration results in test set. (a) Hazy images; (b) results by He et al; (c) results by Yang et al; (d) results by Cai et al; (e) results by Ren et al; (f) our results; (g) real dehazed images
|
Table 1. MSE index
|
Table 2. Index comparison among methods for real hazy images
|
Table 3. Index comparison among methods for images in test set

Set citation alerts for the article
Please enter your email address
© Copyright 2018-2021 | Chinese Laser Press. All Rights Reserved 沪ICP备15018463号-20