Ke-Jing CAO, Ao ZHANG, Jian-Jun GAO. Accuracy estimation of microwave performance for InP HBTs based on Monte-Carlo analysis[J]. Journal of Infrared and Millimeter Waves, 2022, 41(2): 430
Copy Citation Text
In order to verify the reliability of the circuit, the microwave performance for InP HBTs is analyzed based on Monte-Carlo method. The larger the fluctuation range is, the higher the accuracy of extracting intrinsic parameters is required. The allowable accuracy range can be inferred from the output performance. The microwave characteristics are composed of modeled S-parameters, current gain cut-off frequency and maximum oscillation frequency. The standard deviation of Monte-Carlo numerical analysis can be derived from the uncertainty curve of the intrinsic parameters of the π-topology small signal model. The results of Monte-Carlo analysis show that the requirements for the accuracy of measurement parameters are quite different under different frequencies and bias conditions, which verifies the reliability of the circuit under different conditions.
InP-based heterojunction bipolar transistors(HBTs)are gradually applied for the field of microwave and millimeter wave integrated circuits(ICs)with the growing frequencies [1-4]. And accuracy estimation plays an important role in device modeling [5-7],which is essential for a wide range of circuit design [6].
In the process of device modeling,the main reason for the accuracy of the output microwave characteristics of the model is the measurement uncertainty. The S-parameters measured by the vector network analyzer(VNA)are used to establish the small-signal models of the devices. The following uncertainty contributions from measurement should be taken into account:vector network analyzer noise and uncertainty of calibration standard definitions [8]. The effect of VNA noise is estimated by repeated VNA measurements. Compared with calibration standard uncertainty,the influence of VNA noise is often neglected [9].
The uncertainty of measured parameters of each frequency is included in the factory instructions in vector network analyzer. The uncertainty of measured S-parameters will be transferred to the microwave performance accuracy of the HBT model through the de-embedding process and the small-signal circuit parameters extraction. The process of stripping parasitic components(de-embedding)will transfer the uncertainty of measurement parameters. However,many experiments show that the uncertainty transitivity of parasitic components is insignificant,especially for on-chip testing [10]. The sensitivity analysis and uncertainty estimation of π-type small-signal equivalent circuit of HBTs is derived in the paper [11]. The study of accuracy in each intrinsic element has been analyzed;the accuracy estimation of microwave performance for the HBT model by Monte-Carlo methods is further discussed in this paper.
Monte-Carlo method is a common numerical tolerance analysis method,which is often used in statistics. In the equivalent circuit,the Monte-Carlo analysis method can be used to estimate the accuracy range of the whole model in combination with the uncertainty of all parameters. The uncertainty of each component has an impact on the accuracy of the HBT small-signal model. The Monte-Carlo method arranges and combines the possible values of all the components in the accuracy range,and carries out the circuit analysis after random sampling.
In the process of electronic circuit design,Monte-Carlo method is one of the important means to verify the results of circuit reliability analysis. It can analyze the impact on electronic components deviating from the standard value on the output performance,and predict the pass rate before the product is putting into production. On the contrary,the accuracy range of components can be deduced when a certain qualification rate is required.
Electronic circuit tolerance analysis can improve the reliability of electronic circuit designs,shorten the design time and save the design cost. Sun has analyzed the tolerance to the circuit accuracy by using the method of moments before[13],and Teppati has also estimated the uncertainty of the output characteristics of the transistor equivalent circuit [9]. Thus,it is necessary to estimate the accuracy of the circuit model. In this paper,combined with the Monte-Carlo method,the accuracy of microwave performance for devices can be estimated quickly.
This paper is organized as follows. After describing the small-signal model and uncertainties of the intrinsic elements in Sect. 1,the cutoff frequency,maximum oscillation frequency and S-parameters analysis based on Monte-Carlo methods is derived in Sect. 2. Sect. 3 presents the results and discussion. Finally,conclusion is drawn in Sect. 4.
1 Uncertainty of small-signal model
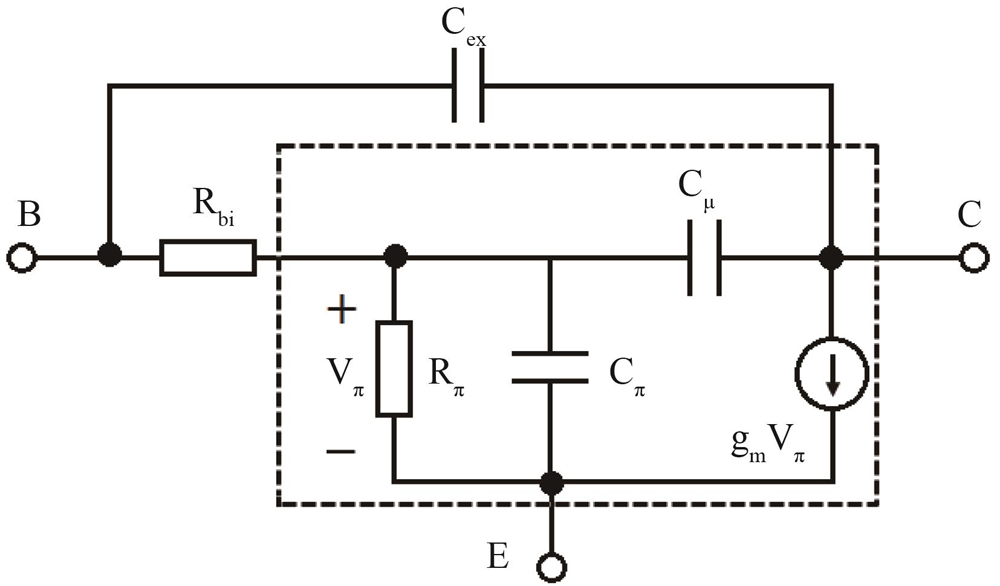
The uncertainty estimation is based on the small-signal model after de-embedding for HBT devices. Figure 1 gives the intrinsic part of π-topology small-signal equivalent circuit model of HBT devices [13],and it is the most basic and widely used model.
Figure 1.The intrinsic part of π-topology small-signal equivalent circuit model of HBT devices
Where is the intrinsic base resistance. represents the base-emitter resistance. and are the intrinsic and extrinsic base-collector capacitance,respectively. is the intrinsic base-emitter capacitance. is trans-conductance,which is expressed as:
,
where represents DC trans-conductance and is time delay.
Direct extraction method is the simplest and most efficient way to build an equivalent model. In the previous paper [11] here choose the π-topology model to analyze sensitivity and uncertainty of HBTs. And the subsequent Monte-Carlo analysis in this paper is based on the sensitivity and uncertainty analysis.
Ignoring the effect of de-embedding,the transfer of uncertainty of the intrinsic part is mainly by the extraction of small-signal elements. Just consider the part in the dotted line of Figure 1 to estimate the uncertainty of these five parameters in this paper.
The sensitivity analysis of the extracted values of the elements should be considered when estimating the uncertainty of the intrinsic elements. To illustrate the uncertainty estimation of model parameters with sensitivity directly is difficult. Therefore,combined with sensitivity analysis and VNA instrument uncertainty,the uncertainty of each element can be expressed concretely [11].
It is worth noting that the uncertainty of each element varies with frequency. But when extracting parameters,the author refers to the point of the minimum uncertainty as the best extraction frequency point. So we only need to consider the minimum uncertainty of each element when we estimate the accuracy of the model circuit performance.
Take as an example,Fig. 2 shows the uncertainty of at three different bias currents [11]. It is found that the uncertainty of is the smallest at about 5.85 GHz at ,about 6 GHz at ,about 5 GHz at . Therefore,these frequency points are selected as the best extraction parameter frequency points,and the uncertainties corresponding to these frequencies are the minimum uncertainties . At the three bias,each is shown in Table 1,as well as the other four intrinsic elements.
Figure 2.Estimated relative uncertainty of intrinsic parameters Cπ versus frequency
The extracted values and the minimum uncertainties of five parameters under different bias are given here. And two other weakly biased correlated values are:. Table 1 summarized the extracted parameters values and minimum uncertainties of intrinsic parameters under the three different bias conditions.
As can be seen from Table 1,the extracted parameters values of the different bias conditions are different,because these five elements are strongly biased correlated. It can be found that of ,, are relatively small under 10%. And the of is over 10% for the sensitivity formulas taking the element value as a factor. The reason why the minimum uncertainty of is the largest is that it is sensitive to the fluctuate of all S-parameters. The of all parameters is related to the bias,but the difference is little,because the parameter extraction values are different under different bias and the optimal extraction frequencies are also different.
2 Theoretical analysis
2.1 Monte-Carlo methods
Monte-Carlo method is a numerical statistics method used to analyze the fluctuation range of device characteristics,which is a mathematical analysis method based on probability. It can not only estimate the accuracy of microwave performance,but also analyze the tolerance in the opposite direction based on the design requirements. By constructing or describing the random distribution of each model parameter in the range of uncertainty and sampling from the random distribution of all parameters,the aggregation of output functions can be established [14].
Simple mathematical expressions are used to indicate this abstract description. For the random distribution of each variable,Gaussian distribution is selected to express independent variables according to the possible distribution of the elements in the circuit. Suppose there are N numbers of elements in an equivalent circuit,and the expression of each variable can be written as:
,
where is the extracted value of the corresponding element,which is regarded as the mathematical expectation value in Gaussian distribution. And the standard deviations correspond to the uncertainty of the element. Define as a sample of ,and ,,…, constitute a sampling model. The sampling model can be expressed as
,
here M is the number of samples. As long as M is large enough,the aggregation of can represent the accuracy range of the model.
In the HBT small-signal model described in Fig. 1,N = 5. The expectation values of each Gaussian distribution corresponding to the values in Table 1. The standard deviation is of each parameter. In the experiment,here take 200 sampling points,M = 200.
2.2 Calculation of microwave characteristics
In order to show the accuracy more intuitively,it is necessary to quantify the microwave characteristics. As the important frequency characteristics of devices, and are the chief microwave performance [15]. It is also necessary to compare the modeled S-parameters with the measured S-parameters,which is an index to measure the correctness of the small-signal model. But the scattering parameter itself is a kind of port parameter,so there is no need to quantize it. Only the quantization formulas for and are given below.
The physical meanings of and are current gain cutoff frequency and maximum oscillation frequency respectively. There are two definitions of :one is the frequency point where transmission hybrid parameter()is equal to 0dB,and the alternative is extracted from the reciprocal slope of the imaginary part for in low frequency of the Gummel’s method [16]. It can be simply defined by mathematical expressions:
, , ,
where is the current gain in case of short circuit which can be transformed from S-parameters. At low frequency,the current gain β is approximately equal to [16].
There are also two ways to define as the frequency at which U or MSG/MAG are equal to 0 dB. U is Mason’s unilateral gain[17]. MSG and MAG are maximum stable gain and maximum available gain. The choice of MSG/MAG depends on the value of the stability factor k. Here are expressions of defining the parameters:
,
,
,
.
All the above parameters expressed by the formulas are based on the small-signal circuit model of HBT and its modeled S-parameters. The accuracy range of the microwave characteristic can be obtained by bringing in the uncertainties of intrinsic elements and the fluctuating S-parameters.
3 Results and analysis
3.1 S-parameters analysis
The comparison between modeled S-parameters and measured S-parameters is one of the criteria to test the correctness of small-signal model in the process of parameter extraction. On the basis of the accuracy of the whole model obtained by Monte-Carlo method,it must impact the magnitude and phase of the four S-parameters.
The experimental observations show that the uncertainties of elements have little effect on the phase of each S-parameter,which hardly fluctuates. Figure 3 uses gray dotted lines to show the sampled S-parameters,and the red lines corresponding to the measured S-parameters. According to the family of grey dotted lines,directly show the fluctuation range of S-parameters when all components fluctuate in Gaussian distribution at the same time. Accuracy ranges of four S-parameters magnitudes versus different frequencies are up to 40 GHz with 40 even points. The bias is .
Figure 3.Magnitude accuracy of S-parameters(45MHz∼40GHz)
It can be observed from Fig. 3 that the fluctuation of S-parameters magnitude is greatly affected by the uncertainties of the elements. The fluctuation range of is the large at low frequencies while is greatly influenced by the uncertainties of elements at high frequencies. The relevance between the accuracy range of and frequency is small,and is more affected by uncertainties than .
The main parameters affecting the microwave performances of the device are and . The physical meaning of is the reflection coefficient or reflection loss of the device. And reflects the amplification ability(gain)of the active device. It can be seen from the fluctuation range in Fig. 3 and the deviation rate in Fig. 4 that the deviation of the reflection coefficient is small. It indicates that the uncertainty of intrinsic parameters has little effect on ,and has little effect on its accuracy. When the frequency is below 10 GHz,the gain()is greatly affected by the fluctuation of intrinsic parameters. It indicates the value of in this frequency range is easily affected by the small deviation of parameter extraction,which requires high precision of parameter extraction.
Figure 4.Positive and negative deviation rates of S-parameters(45 MHz∼40 GHz)
In order to quantify the fluctuation range,a concept called deviation rate is proposed. The definition of deviation rate is as follows:
,
.
Both positive and negative deviation rates change with frequencies,which are also shown in Fig. 4. Each positive deviation of S-parameters is represented by a cerulean curve while the negative deviation is represented by a red curve. The bias condition is the same as Fig. 3,.
3.2 Current gain cutoff frequency analysis
From the definition of characteristic frequency(current gain cutoff frequency) in the previous chapter,the first definition is relatively simple and easy to understand. So just need to draw the curve of versus frequency to get . As shown in Figure 5,the abscissa value of log type is used to compress the decrease from 45 MHz to 100 GHz,so that the characteristic frequency can be more clearly displayed. It can be seen from the figure that the frequency measured in the experiment at 40GHz cannot reach the frequency of . From the observation of the relationship between and frequency,each curve is ultimately parallel,decreasing at the speed of - 20dB per decade frequency,writing as -20dB/dec.
Figure 5.H21 versus frequency and accuracy range of current gain cutoff frequency
It is worth noting that has a large fluctuation range below 1GHz from Fig. 5. The main factor that affects is the gain of transistor,while represents the gain. Combined with the four S-parameters,and from the above figure of , is easy to be affected by the fluctuation of intrinsic parameters at lower frequency,so the accuracy of intrinsic parameters extraction is required to be higher.
Informed of Fig. 5,can find that the accuracy of is obvious. The red dotted lines are -20dB/dec extended reference lines,which draw the extension line of the measured data and the extension line range given by the sample data. From the -20dB/dec extension lines,the accuracy range of is about 45 to 71 GHz at . The value ranges of under the other two bias conditions are also obtained,which are listed in Table 2 together with . When the collector-emitter voltage is fixed,the larger the base input current is,the larger the value of is. It can also be seen from the experimental data in Table 2 that the accuracy range increases with the increase of .
Bias
Value
Accuracy
Value
Accuracy
Value
Accuracy
60
(45,71)
68
(53,88)
87
(66,100)
(U)
31
(23,40)
43
(30,52)
50
(36,70)
(MSG/MAG)
32
(31,40)
46
(40,52)
53
(45,63)
Table 2. Values and accuracy range of fT and fMAX at three bias points
is an important power index in RF circuit design. The two definitions mentioned in the theoretical analysis are discussed separately in Figure 6. It is similar to the method of ,draw the curve of versus frequency,and extend the curve to U=0 dB according to -10 dB/dec extension line. Since power corresponds to the formula of square =10 log10U,use -10dB/dec instead of -20 dB/dec here. In addition,the curve connecting MSG and MAG is also drawn for comparison in Fig. 6. Both of them use the gray dotted lines to represent the accuracy range.
Figure 6.U andMSG/MAG versus frequency with uncertainty
It can be seen from Fig. 6 that the variation of is also obvious,which indicates that the uncertainties obtained by the measurement of the intrinsic elements greatly affect the performance of microwave characteristics. The values of obtained by the two definitions have little different. The accuracy range defined by is much larger than that defined by MSG/MAG. Compared with the curve of ,the fluctuation of the curve obtained by the two definitions of is smaller.
And the accuracy ranges of under the three bias conditions(, and )are tabulated in Table 2 together with .
It can be seen from Table 2 that when the voltage is constant,the larger the bias current is,the larger the values of and are. The larger the values of and are,the larger the fluctuation ranges are. This shows that when the bias current is larger,the microwave performance of the device has tighter requirement on the accuracy of the intrinsic parameters extraction.
4 Conclusion
This paper presents an accuracy estimation method for microwave performance of InP HBTs based on Monte-Carlo analysis. Based on the π-topology small-signal model,the intrinsic elements transmit the uncertainty of measurement parameters. Through the derivation and analysis of Monte-Carlo method,an approach to estimate the overall microwave performance of the model is obtained. Accuracy ranges of the modeled S-parameters,current gain cutoff frequency and maximum oscillation frequency are presented in details. The results reflect the uncertainty of VNA measurement S-parameters affects the microwave performance in different degrees. It is necessary to evaluate the performance of devices before the circuit design,and Monte-Carlo analysis is an important index. Thus,some EDA simulation tools have the function of Monte-Carlo simulation to improve reliability. This paper mainly from the statistical point of view on the Monte-Carlo analysis,combined with sensitivity and uncertainty,analyzed the accuracy performance of microwave performance.
[3] Zhong-Chao XU, Jun LIU, Feng QIAN et al. On-wafer test structures modeling for the InP DHBTs in the frequency range of 0.1-325 GHz. J.Infrared Millim.Waves, 38, 345-350(2019).
[10] S M Masood, T K Johansen, J Vidkjaer et al. Uncertainty Estimation in SiGe HBT Small-Signal Modeling: European Gallium Arsenide and Other Semiconductor Application Symposium, GAAS 2005, 393-396(2005).
[12] Wei SUN, R CHEN. M.M.; JIANG Yao-Lin. Tolerance analysis for electronic circuit design using the method of moments: 2002 IEEE International Symposium on Circuits and Systems, Proceedings (Cat. No. 02CH37353), 2002, I-I(2002).
[17] C R Bolognesi, N Matine, M W Dvorak et al. InP/GaAsSb/InP DHBTs with high fT and fMAX for wireless communication applications: Gallium Arsenide Integrated Circuit (GaAs IC) Symposium, 21st Annual, 1999, 63-66(1999).
Ke-Jing CAO, Ao ZHANG, Jian-Jun GAO. Accuracy estimation of microwave performance for InP HBTs based on Monte-Carlo analysis[J]. Journal of Infrared and Millimeter Waves, 2022, 41(2): 430