
Kuo Luo, Yuyao Wang, Borong Zhu, Kuanglu Yu. Noise Reduction of Brillouin Distributed Optical Fiber Sensors Based on Generative Adversarial Network[J]. Acta Optica Sinica, 2024, 44(1): 0106024
- Acta Optica Sinica
- Vol. 44, Issue 1, 0106024 (2024)
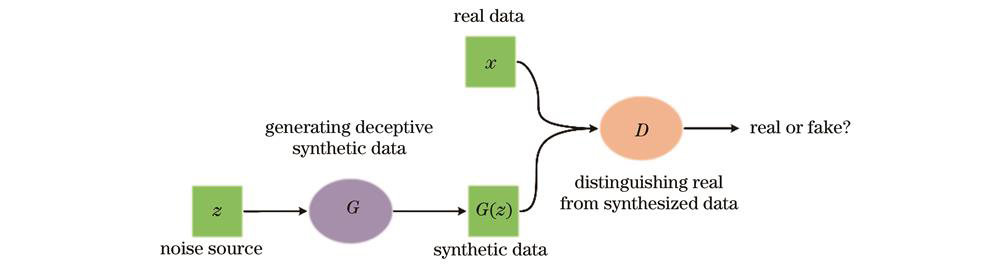
Fig. 1. Basic structure of GAN model
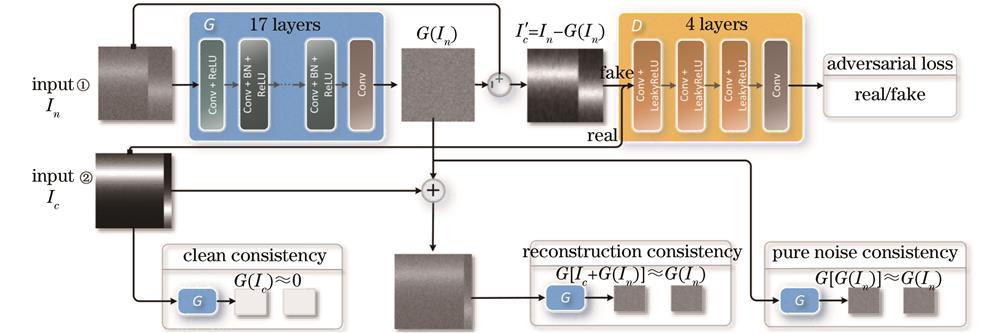
Fig. 2. Structure of SCGAN
Fig. 3. Experimental device diagram of BOTDA sensing system
Fig. 4. BGS data. (a) Experimental BGS (last 640 m); (b) simulated BGS; (c) cropped experiment BGS
Fig. 5. Test data noise reduction results of different networks. (a) (d) DnCNN; (b) (e) ADNet; (c) (f) BRDNet
Fig. 6. Temperature distribution obtained after denoising test data using BRDNet trained on SCGAN noise
Fig. 7. Comparison of noise reduction effects of three convolutional networks training by two noise on test data at different temperatures. (a) (d) DnCNN; (b) (e) ADNet; (c) (f) BRDNet
Fig. 8. Comparison of noise reduction effect of three convolutional networks training by two noise on test data with different averaging times. (a) (b) DnCNN; (c) (d) ADNet; (e) (f) BRDNet
Fig. 9. Noise analysis. (a) Noisy data; (b) noise generated by SCGAN; (c) Gaussian noise; (d) noise comparison along frequency direction; (e) noise comparison along the direction of sampling point
Fig. 10. Noise histograms. (a) Gaussian noise; (b) SCGAN noise
Fig. 11. Noise amplitude spectra. (a) Gaussian noise; (b) SCGAN generated noise; (c) noise obtained from collected data
| ||||||||||||||||||||||||||||||||||||||||||||||||||||||||||||||||||||
Table 1. SNR comparison of experimental data at different temperatures by denoising networks trained on two types of noise
| ||||||||||||||||||||||||||||||||||||||||||||||||||||||||||||||||||||||||||||||||||||||||||||||||||||||||||||||||||||||
Table 2. SNR comparison of experimental data of different averaging times by denoising networks trained on two types of noise

Set citation alerts for the article
Please enter your email address
© Copyright 2018-2021 | Chinese Laser Press. All Rights Reserved 沪ICP备15018463号-20