
Chenjing Quan, Xiao Xing, Sihao Huang, Mengfeifei Jin, Tongchao Shi, Zeyu Zhang, Weidong Xiang, Zhanshan Wang, Yuxin Leng, "Nonlinear optical properties of CsPbClxBr3-x nanocrystals embedded glass," Photonics Res. 9, 1767 (2021)
- Photonics Research
- Vol. 9, Issue 9, 1767 (2021)
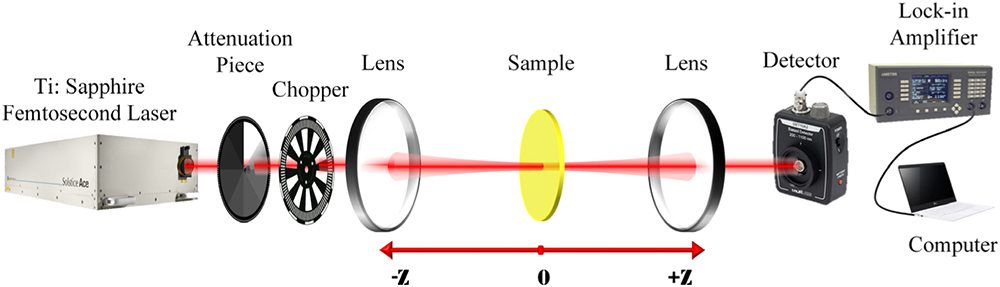
Fig. 1. Experimental setup for the Z-scan technique.
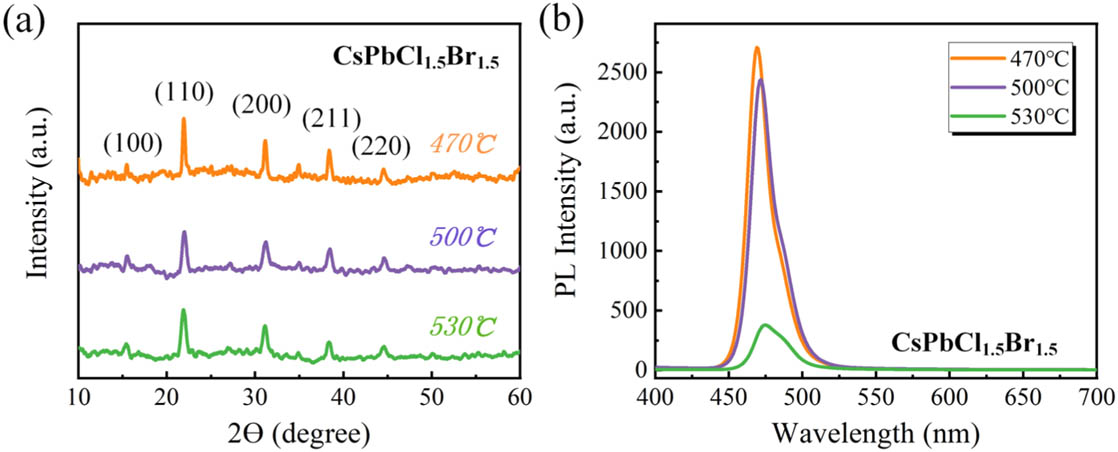
Fig. 2. (a) XRD patterns and (b) PL emission spectra of CsPbCl 1.5 Br 1.5
Fig. 3. OA Z-scan results of CsPbCl 1.5 Br 1.5 25.5 GW / cm 2 217 GW / cm 2 β γ CsPbCl 1.5 Br 1.5
Fig. 4. (a) OA Z-scan curves and (b) corresponding fitting results of β Im χ ( 3 ) CsPbCl 1.5 Br 1.5
Fig. 5. OA Z-scan results of CsPbCl x Br 3 − x x = 1 178 GW / cm 2 535 GW / cm 2 CsPbCl x Br 3 − x x = 1 β γ
Fig. 6. (a) Transmission electron microscopy (TEM) images of CsPbClx Br3-x (x = 1, 1.5, 2) NCs and (b) high-resolution TEM images of CsPbCl1.5Br1.5 NCs.
Fig. 7. (a) Amplified spontaneous emission (ASE) measurement on CsPbCl1.5Br1.5 NCs glass under an 800 nm pulsed laser at room temperature and (b) corresponding full-width at half-maxima (FWHM) and output as a function of incident pump intensity.
Fig. 8. (α h υ h υ x Br3-x (x = 1 , 2 , 3
Fig. 9. Open-aperture Z-scan curves of the (a) CsPbCl1Br2 and (b) CsPbCl2Br1 NCs glasses at the wavelength of 800 nm with different incident pump intensity.


Set citation alerts for the article
Please enter your email address

© Copyright 2018-2021 | Chinese Laser Press. All Rights Reserved 沪ICP备15018463号-20