
Yong Huang, Chuanchao Wu, Shaoyan Xia, Lu Liu, Shanlin Chen, Dedi Tong, Danni Ai, Jian Yang, Yongtian Wang. Boundary segmentation based on modified random walks for vascular Doppler optical coherence tomography images[J]. Chinese Optics Letters, 2019, 17(5): 051001
- Chinese Optics Letters
- Vol. 17, Issue 5, 051001 (2019)
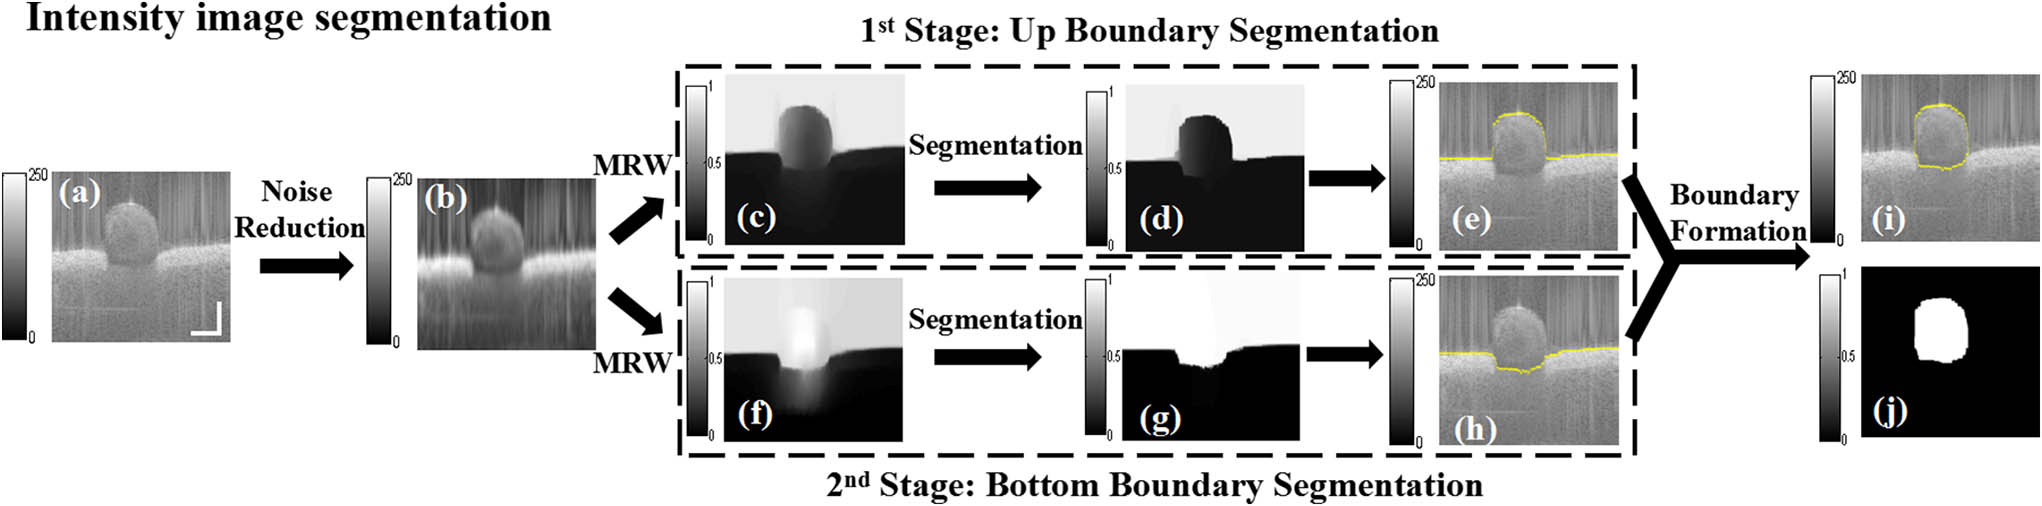
Fig. 1. MRW algorithm segmentation procedure of intensity image. First stage shows the process of upper boundary segmentation. Second stage shows the process of bottom boundary segmentation. Then, they are combined to create an intact boundary mask (scale bar: 500 μm).
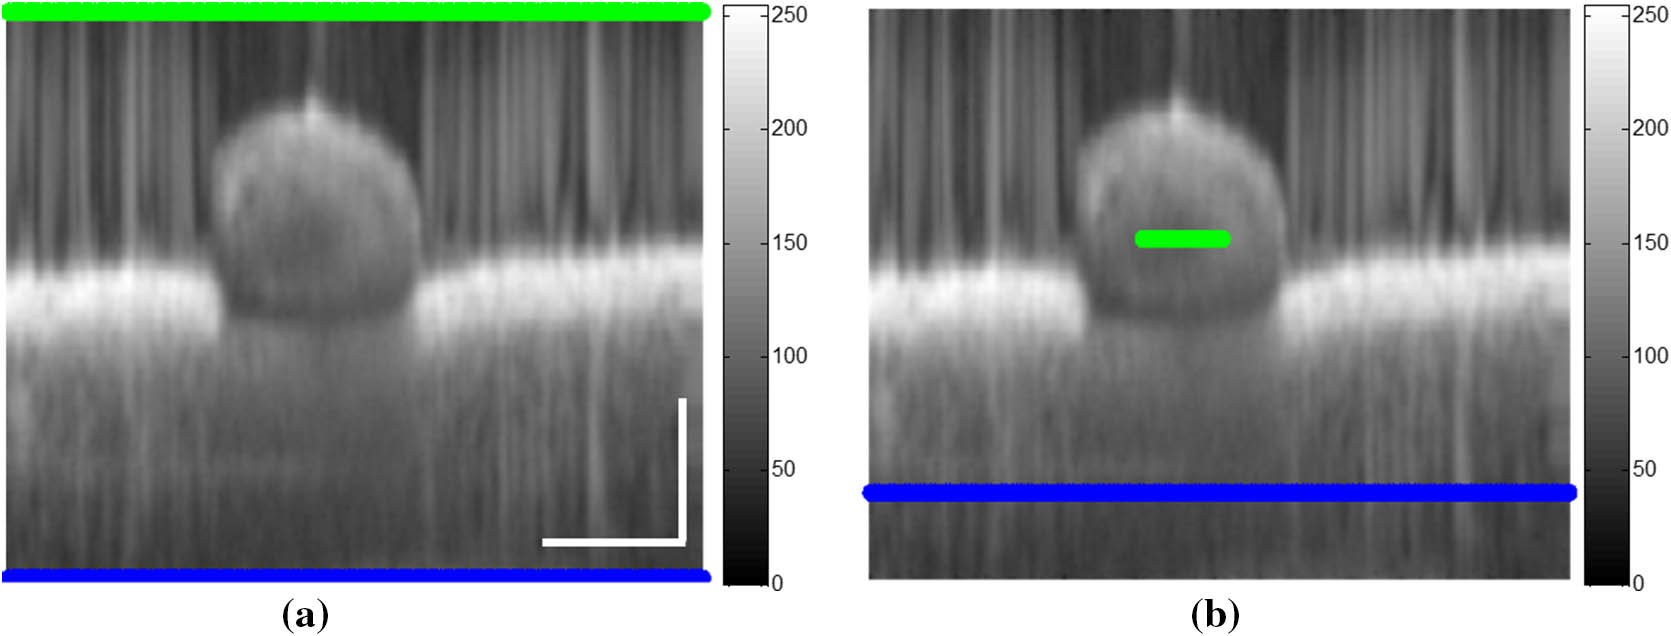
Fig. 2. Selection of seed points in the segmentation stages for OCT intensity image. (a) Two kinds of seeds are selected for the upper boundary segmentation in the first stage, marked by green and blue lines, respectively. (b) Two kinds of seeds are selected for the bottom boundary segmentation in the second stage, marked by green and blue lines, respectively (scale bar: 500 μm).
Fig. 3. Segmentation procedure of the phase image. We combined phase image with a boundary mask to remove the background, and then made use of the threshold condition to get the blood flow region (scale bar: 500 μm).
Fig. 4. Probability map and corresponding segmentation results using different regularization. (a) Probability map using the regularization
Fig. 5. Segmentation results of different OCT frames. (a-1)–(d-1) OCT intensity images of frames 1, 65, 131, 192, and segmentation results, respectively. (a-2)–(d-2) OCT phase images of frames 1, 65, 131, 192, and segmentation results, respectively (scale bar: 500 μm).
Fig. 6. 3D reconstruction of the vessel. (a) The upper part of the blood vessel. (b) The bottom part of the blood vessel. The arrows point at the thrombosis position.
Fig. 7. (a) Blood flow area variation along the blood flow axis. (b) Blood vessel radius variation along the blood flow axis.
| |||||||||||||||||||||||||||||||||||||||||||||
Table 1. Evaluation Parameter Comparison Between Segmentation Results and Ground Truth

Set citation alerts for the article
Please enter your email address
© Copyright 2018-2021 | Chinese Laser Press. All Rights Reserved 沪ICP备15018463号-20