
Yong Li, Guanghui Zhang, Lihong Ma, Xiaolin Ying, Jianyun Yao. Review of dynamic three-dimensional surface imaging based on fringe projection[J]. Infrared and Laser Engineering, 2020, 49(3): 0303005
- Infrared and Laser Engineering
- Vol. 49, Issue 3, 0303005 (2020)
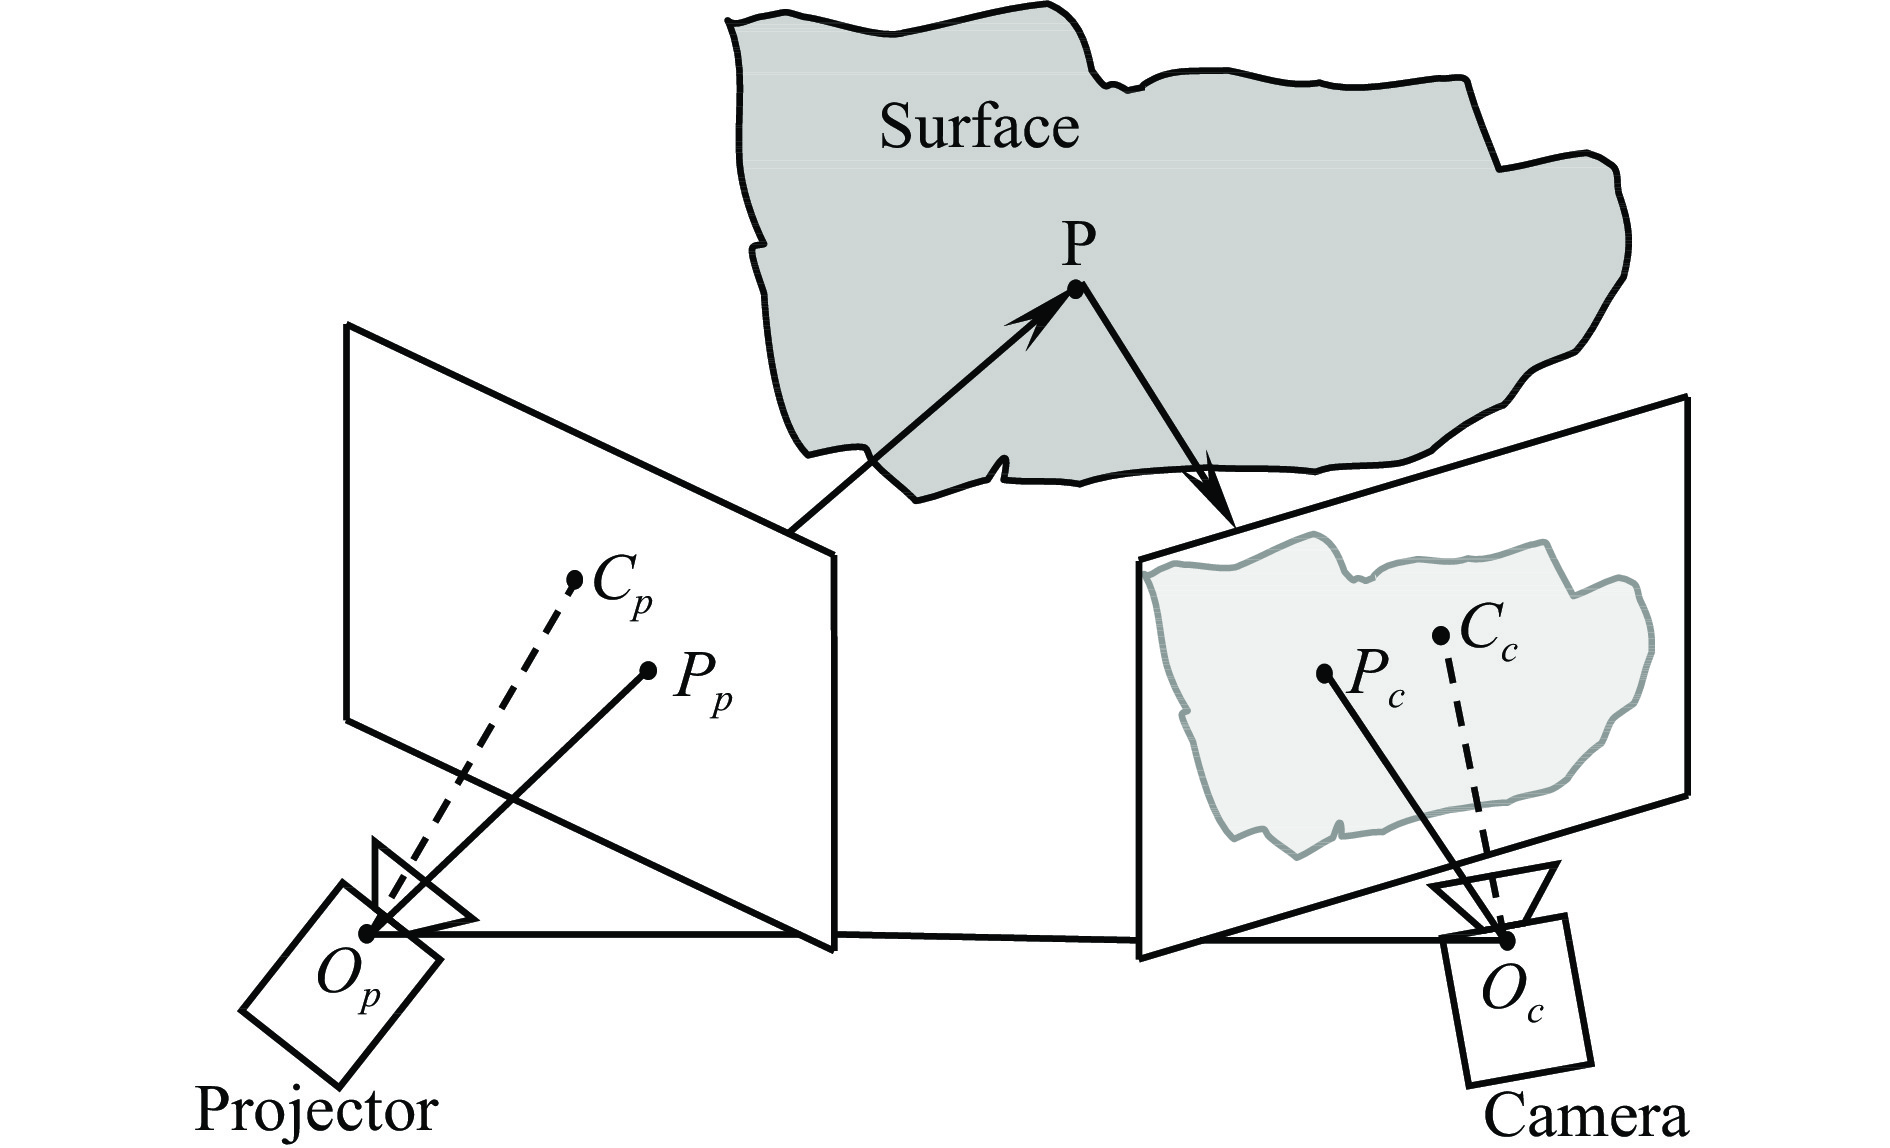
Fig. 1. Schematic diagram of fringe projection based 3D measurement system
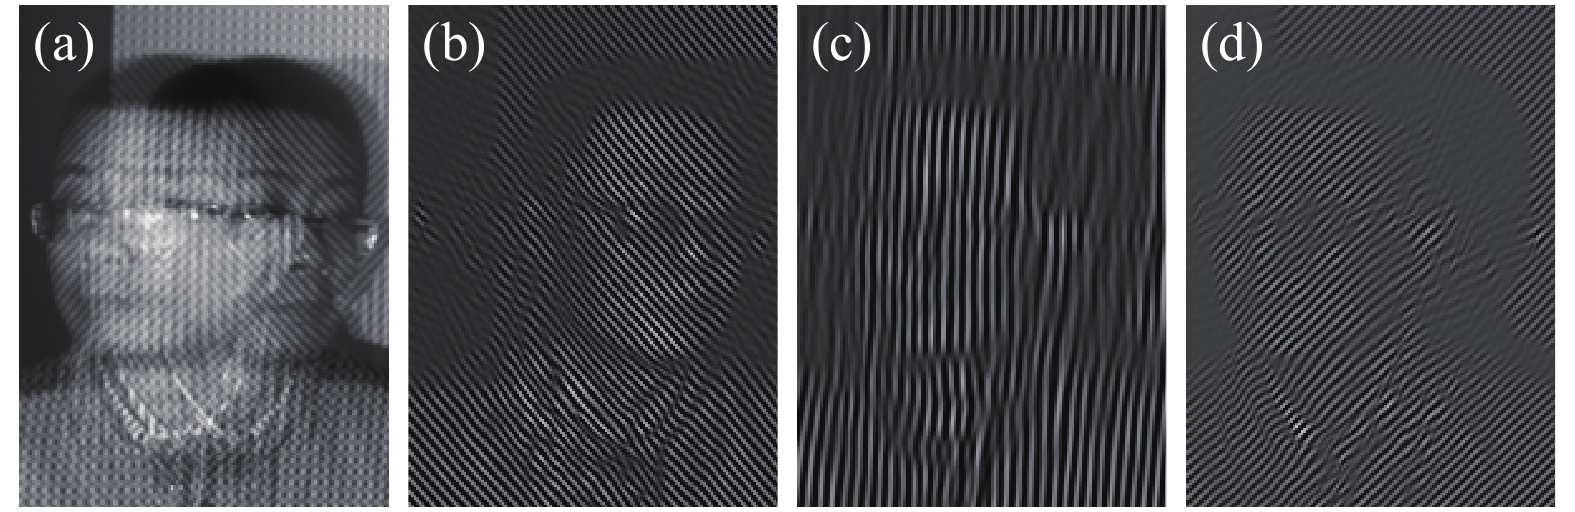
Fig. 2. Experimental results of frequency multiplexing. (a) Original image; (b), (c), (d) fringes image at different moment separated by filtering
Fig. 3. Experimental results of color multiplexing. (a) Original image; (b), (c), (d) Fringes image at different moment separated by color
Fig. 4. Schematic diagram of multi period scanning and sampling
Fig. 5. Experimental results of vibration modes of the loudspeaker membrane. (a) Excitation frequency of 660 Hz; (b) Excitation frequency of 1 000 Hz
Fig. 6. A set images of dynamic face measurement sequence. (a),(b) High frequency fringes with phase difference 2π/3; (c) Low frequency fringe; (d) Image obtained with white light illumination; (e),(f) Images obtained with red and green light illumination separately
Fig. 7. Measurement results of expression change. (a),(b) Expression at different moment; (c) 3D shape with color texture
Fig. 8. Schematic diagram of projection distance minimization
Fig. 9. Example pattern of 3 level 2D spatial coding
Fig. 10. Relationship of fringe order and code
Fig. 11. Experimental results of absolute phase for two dimensional three level spatial coding method. (a) Deformed fringe; (b) Depth map
Fig. 12. Schematic diagram of multi-view geometric constraints
Fig. 13. Experimental results of phase compensation. (a) Phase measured by PMP; (b)-(d) Results of phase compensation by FAPS, WFAPS and GWFAPS separately;(e) Result combining GWFAPS with PMP
Fig. 14. Comparison of different algorithm for obtaining phase. (a) By Fourier transform; (b) By background- eliminated Fourier transform; (c) By background-normalized Fourier transform

Set citation alerts for the article
Please enter your email address
© Copyright 2018-2021 | Chinese Laser Press. All Rights Reserved 沪ICP备15018463号-20