1State Key Laboratory for Superlattices and Microstructures, Institute of Semiconductors, Chinese Academy of Sciences, Beijing 100083, China
2College of Materials Science and Opto-Electronic Technology, University of Chinese Academy of Sciences, Beijing 101408, China
3Center of Materials Science and Optoelectronics Engineering, College of Materials Science and Opto-Electronic Technology, University of Chinese Academy of Sciences, Beijing 100049, China
4Key Laboratory of Semiconductor Materials Science, Beijing Key Laboratory of Low Dimensional Semiconductor Materials and Devices, Institute of Semiconductors, Chinese Academy of Sciences, Beijing 100083, China
For the measurement of responsivity of an infrared photodetector, the most-used radiation source is a blackbody. In such a measurement system, distance between the blackbody, the photodetector and the aperture diameter are two parameters that contribute most measurement errors. In this work, we describe the configuration of our responsivity measurement system in great detail and present a method to calibrate the distance and aperture diameter. The core of this calibration method is to transfer direct measurements of these two parameters into an extraction procedure by fitting the experiment data to the calculated results. The calibration method is proved experimentally with a commercially extended InGaAs detector at a wide range of blackbody temperature, aperture diameter and distance. Then proof procedures are further extended into a detector fabricated in our laboratory and consistent results were obtained.
The responsivity or quantum efficiency (QE) of photodetector characteristics is its ability to respond to a photo signal quantitatively. In conjunction with a photodetector’s electrical noise, responsivity can be used to derive signal-to-noise ratio, which is proportional to the so-called detectivity proposed by Jones[1], by dividing responsivity with the root mean square (RMS) of electrical noise[2]. Since the detectivity of a photodetector is independent on measurement conditions and the types of detectors, it is convenient to use detectivity as a parameter to compare the detectors’ performance reported from different laboratories. In addition, responsivity or QE of photo detectors can be used to extract minority carrier diffusion length[3−7], lifetime[5, 6, 8] and surface recombination velocity[9]. In such situations, a precise measurement of responsivity is crucial. Although nearly all of the works regarding the performance of infrared photodetectors reported the responsivity or QE of detectors[3, 10−13], details involving the configuration and calibration of the measurement system were rarely presented.
To measure the responsivity of an infrared photodetector, the most used radiation source is a blackbody that radiates light with a wide spectrum. The major concern that comes with using a blackbody as an infrared source is how to determine the light power that is reached at the surface of the photodetector. There are two main methods to calculate the power of incident light. The first one is to use a calibrated photodetector to measure light power. But, in practice, this method is subject to the package and availability of calibrated photodetectors. In order to ensure the accuracy of measured light power, a calibrated photodetector has to be mounted at the same position as the detector under test (DUT) which is usually sealed in a cryostat. If the package of the calibrated photodetector is different from the DUT, the above mounting requirement for the calibrated photodetector would be difficult to satisfy. Moreover, several different types of calibrated photodetectors are necessary to cover a wide spectrum range of filtered light, for example, an InGaAs photodetector for short wavelength infrared[14], an InSb photodetector[15] for mid wavelength infrared and a HgCdTe photodetector for long wavelength infrared. The availability of such calibrated detectors is not easy and the financial burden for acquiring such calibrated photodetectors is another thing. Another method is to directly calculate the light power that was received by the DUT according to Planck’s radiation law[16]. For this method, distance between the blackbody and DUT and the diameter of aperture play a crucial role in the accurate calculation of light power. The precise measurement of distance and aperture diameter is challenging work and researchers in this area rarely report their methods to do such measurement in detail. Another issue involved in the measurement of the responsivity of the infrared photodetector is how to extract the photodetector response signal with a large signal-to-noise ratio. A general solution to this problem is to modulate incident infrared with a chopper and filter response signal out using a lock-in amplifier. The measurement system of such a solution is widely spread and easy to build. But the demodulation of the response signal in such a system requires abundant knowledge about equipment. Moreover, literature scarcely covers this topic.
In this work, we report a method used in our group at the Institute of Semiconductors to measure the responsivity of infrared photodetectors. For the determination of blackbody radiation power, we choose the calculation method. Instead of measuring the distance and aperture diameter directly, an extraction principle, that is, measuring the response signal of the DUT as a function of distance and aperture diameter and then fitting measured data to extract the distance and aperture diameter, is employed. For the demodulation of the response signal, we explain its mechanism mathematically in great detail. The remainder of this paper is recognized as follows. In section 2, we describe the configuration of our measurement system and list the equations used for responsivity calculations. Section 3 explains demodulation mechanisms and extraction principles. We verify the extraction principles and present the extracted distance and aperture diameter in section 4. Finally, conclusions are presented in section 5.
System configuration and methodology
The responsivity measurement system used in this work consists of a CI System SR-200 cavity blackbody, a Stanford Research System SR830 DSP lock-in amplifier and an SR570 low-noise current preamplifier, a mechanical chopper and infrared bandpass filters purchased from Thorlabs. The light irradiated from the blackbody is modulated by a mechanical chopper to maximize the signal-to-noise ratio of the response signal. Then the modulated ray is filtered by a bandpass filter before it could be received by the DUT mounted in a cryostat. The modulated alternating response current of the DUT is amplified, filtered and outputted as an alternating voltage signal by SR570. Finally the alternating voltage signal was filtered out by SR830 with a reference frequency supplied by the controller of the mechanical chopper.
After building the responsivity measurement system, the last two steps before obtaining responsivity are to calculate the light power received by the DUT and demodulate the response current of the DUT. The SR-200 cavity blackbody used in our system has an emissivity of 0.99 with an uncertainty of 0.01. Thus, it is reasonable to predict its exitance by the following equation according to Planck’s Law,
where is the Planck’s constant, is the light speed, is the Boltzmann’s constant, and is the temperature in Kelvin. Eq. (1) specifies total energy at wavelength radiated into the whole space by a blackbody with a unit area. In practice, the radiation area of a blackbody is defined by the aperture mounted at the front of the blackbody and a bandpass filter is used to narrow the spectrum of radiated light. Moreover, the surface of the DUT only receives the power in the projected solid angle that subtends by the aperture[16]. In such a case, the light power received by the DUT can be calculated using the following equation[16],
where is the area of the detector, is the transmittance function of the bandpass filter, and are the short and long cut-off wavelength of the bandpass filter respectively, and is the projected solid angle that subtends by the aperture and it can be calculated using the following equation[16],
where is the diameter of the aperture and is the distance between the DUT and blackbody source. If we assume that transmittance is independent on the wavelength, the transmittance TF can be pulled outside the integral.
In order to obtain the responsivity of the DUT, we need to measure the response signal of the DUT. Using the above measurement system, the modulated light of the blackbody induces an alternating photo current flowing through the DUT. The alternating photo current can be demodulated and calculated using the following equation,
where is the response voltage measured by an SR830 lock-in amplifier, is the amplification factor of SR570 in voltage per Ampere, and is the modulation factor, which relates to the demodulation process of the SR830 lock-in amplifier. Combined with Eqs. (2)–(4), the responsivity of a detector may be calculated using the following equation,
where TF is the transmittance function of the bandpass filter and we assume its wavelength is independent here.
Modulation factor, the distance and the aperture diameter
As we described before, the demodulation of the response signal and measurement of distance and diameter are two major concerns in calculating responsivity. In this section, we describe demodulation principles and present our methods of measuring the distance and diameter. To determine the value of , we need to know how the alternating voltage signal is demodulated in the lock-in amplifier. If the tooth of the mechanical chopper is much larger than the aperture, the photo current flowing through the DUT is nearly a square wave. This square wave can be treated as a sum of a series of sinusoidal waves, as it shows below:
where is the value of the photo current when the DUT is under irradiation, and is the frequency of the square wave. The effect of the SR570 preamplifier on the photo current may be represented as amplification factor . Then its output could be well-described by the following equation,
The SR830 lock-in amplifier singles out one sinusoidal component of Eq. (6) by multiplying a sinusoidal wave with its frequency locked to the reference frequency that is supplied by the chopper controller. It should be noted that one can select the sinusoidal component that was singled out by setting the harmonics number through SR830. In all our measurements, the first sinusoidal component of Eq. (7), , is singled out. Since the SR830 display output signal in RMS, the amplitude of the above base harmonic component, , will be equal to . Thus, the modulation factor, , is equal to .
From Eq. (5) or (3), one can see that the distance between the blackbody and DUT is a major source of uncertainty. This assumption is justified by the fact that light power has a square dependence on distance. One may obtain the distance by several separate measurements and add them up. For example, choose a reference point on the cryostat, then measure the distance between the reference point and the blackbody, the distance between the reference point and the DUT. However, such measurements could hardly yield results with satisfactory accuracy. Instead of measuring the distance directly, we turned to measure the relative distance and managed to extract the absolute distance between the blackbody and DUT by fitting the experiment data according to Eq. (5). By mentioning relative distance, we mean the distance that is between a reference point on the cryostat and one reference origin on the line determined by the DUT and blackbody. The absolute distance between the blackbody source and DUT will be equal to the sum of the relative distance and an offset distance, which is defined to be the distance between the blackbody source and the reference origin. By carefully choosing the reference point and origin, relative distance can be measured with an accuracy better than 1 millimeter. A multitude of experiment data guarantees the accuracy of extracted offset distance and absolute distance further.
For a given DUT, blackbody temperature, filter and amplification factor, the product of in Eq. (5) will be a constant. We rewrite it as and we denote as . Thus, Eq. (5) can be rewritten as
or
where and are the relative and offset distance respectively. The offset distance, , could be extracted by fitting the experimental data set of versus according to Eq. (8). Considering the fact that is a constant for a given DUT, Eq. (9) could be used to extract and simultaneously.
In Eq. (8), if we treat the offset distance as a known parameter and the aperture diameter as an unknown parameter, then it could be rewritten as
where D is the absolute distance. If responsivity , constant are known and response voltage and absolute distance D are measured, it is possible to extract the aperture diameter according to Eq. (10).
Results and discussions
To prove the validity of the calibration method described in section 3, we use a commercial, extended InGaAs detector to extract the offset distance and aperture diameter of our responsivity measurement system. The commercial, extended InGaAs detector, model name DET10D, with a response wavelength from 0.8 to 2.6 μm was purchased from Throlabs, and it had an active area of 1 mm in diameter. The bandpass filter used in the following measurement had a central wavelength of 2.25 μm and a 0.5 μm full width at half maximum. Its transmissivity is averaged over its full width at half maximum and a value of 0.654 is yielded. The SR570 preamplifier transferred the photo current of the DET10D InGaAs detector into the voltage signal by a user-specified magnification.
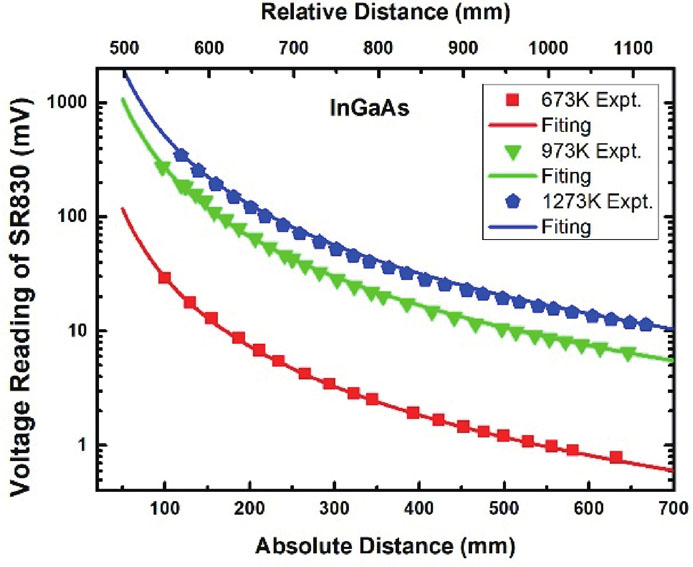
Fig. 1 shows the response voltage of the DET10D InGaAs detector measured by the SR830 lock-in amplifier versus the distance between the detector and the blackbody. To check the consistency of the extracted offset distance, the measurement and extraction procedure were down at three different blackbody temperatures, which were 673, 973 and 1273 K. At all three blackbody temperatures, an aperture with a nominal diameter of 3.2 mm was chosen. During measurement, we only recorded the relative position of the DUT, whose position could be read from a rail with a scale on it. At blackbody temperatures of 673, 973 and 1273 K, a magnification of 1, 2 and 5 were set respectively. Thus, the value for constant will be , and respectively. To calculate the response voltage of SR830 using Eq. (8), we needed to know the responsivity of DET10D InGaAs detector at 2.25 . Since the DET10D InGaAs detector used in our laboratory was not calibrated, we used a typical value of 1.3 A/W, which is available from its datasheet, at 2.25 instead. By changing the value of the offset distance, we tried to fit the measured voltage signal of SR830 with the calculated one using Eq. (8). However, no matter what value is used for the offset distance, there is always a gap between calculated curves and experiment data. When the distance between the DUT and the blackbody increases, calculated results predict a faster damping rate of response voltage compared with measured data. We realized that a faster damping rate comes from underestimating the aperture diameter. Then we multiplied the nominal aperture diameter 3.2 mm with a correction factor and changed the value of to fit measured data with Eq. (8) again. Inversely, for a large correction factor, such as 1.5, Eq. (8) yields a slower damping rate of response voltage compared with experiment data. Finally, a factor of 1.25 was chosen for its excellent fitness of calculated and measured data at all three blackbody temperatures. The initial response voltage data was measured at a relative distance of 548, 545 and 567 mm for blackbody temperature 673, 973 and 1273 K respectively. According to Eq. (8), a best fitting yields an absolute distance of 100, 97 and 119 mm corresponding to the relative distance of 548, 545 and 567 mm respectively. An offset distance of –448 mm was extracted for our responsivity measurement system with the DET10D InGaAs detector as the DUT.
Figure 1.(Color online) Measured and calculated response voltage of a DET10D InGaAs detector radiated by a blackbody heated to 673 , 973 and 1273 K respectively. A nominal aperture diameter of 3.2 mm is chosen. The scatterplot shows experiment results and the solid line is fitting results according to Eq. (8).
In the fitting procedures of the offset distance, a correction factor of 1.25 for the 3.2 mm nominal aperture is necessary to yield a close fit. This result reminds us that other sizes of aperture provided by the vender of the blackbody might also need to be corrected. Thus we measured a set of response voltage of SR830 as a function of the relative distance of the DET10D InGaAs detector with a nominal aperture diameter ranging from 0.8 to 22.2 mm, as is shown in Fig. 2. This experiment data was obtained with a blackbody heated to 973 K and the magnification of the SR570 preamplifier set to 50 , 200 , 1 , 2 , 5 , 10 , 20 and 20 for nominal aperture diameter of 0.8, 1.6, 3.2, 6.4, 9.5, 12.7, 15.9 and 22.2 mm respectively. If we plot Fig. 2 using raw data obtained with such magnifications, however, the voltage reading of SR830 will overlap. For clarity of presentation, this raw data is rescaled with a magnification of 20 and then plotted into Fig. 2. Therefore, the value for constant will be for all aperture sizes. The responsivity of the DET10D InGaAs detector at 2.25 is still assumed as 1.3 A/W. Fitting measured data with Eq. (8), we obtain a correction factor of 1, 1.2, 1.25, 1.25, 1.25, 1.25, 1.25 and 1.18 for apertures with a nominal diameter of 0.8, 1.6, 3.2, 6.4, 9.5, 12.7, 15.9 and 22.2 mm respectively. When the nominal aperture diameter is larger than 9.5 mm, there is an obvious gap between measured data and the calculated curve at the short distance side. As the aperture diameter increases, the gap grows larger and the point at which the gap between measured data and the calculated curve appears extends into a longer absolute distance. For example, the gap appears at about 140 mm when the nominal aperture diameter is 9.5 mm, while, for an aperture diameter of 22.2 mm, it occurs at about 300 mm. According to Eq. (2), the radiation power of a blackbody is proportional to the inverse of the D square. Thus, at the short distance side, the DET10D InGaAs detector receives a high radiation power and this power attenuates dramatically as the distance between the DUT and the blackbody increases. For example, radiation power at 300 mm is only about 11% of that at 100 mm. Considering this fact, we speculate that the reason for these gaps might come from a nonlinear responsivity of the DET10D InGaAs detector. With the nonlinear responsivity assumption in mind, and using Eq. (2), we estimated that the incident power density at which the nonlinear occurs is around . Due to the existence of the gap between measured and calculated data, the extracted aperture diameter for a diameter larger than 9.5 mm, especially for the 22.2 mm aperture, might be incorrect. In the following, we experimentally verify the existence of nonlinear responsivity of the DET10D InGaAs detector and extract the aperture diameter with another method. In addition to aperture diameter, this group of data also yields an offset distance of −448 mm, which is consistent with the result obtained in Fig. 1.
Figure 2.(Color online) Measured and calculated response voltage of a DET10D InGaAs detector radiated by a 973 K blackbody with aperture diameter of 0.8, 1.6, 3.2, 6.4, 9.5, 12.7, 15.9 and 22.2 mm respectively. The scatterplot shows experiment results and the solid line is fitting results according to Eq. (8).
When the blackbody is heated to 973 K and aperture is set to the one with a 6.4 mm diameter, the nonlinear responsivity of the DET10D InGaAs detector only occurs at an absolute distance below 105 mm as it was shown in Fig. 2. Using a same aperture diameter but a higher blackbody temperature, we may expect that the nonlinear responsivity of the DET10D InGaAs detector will occur at a longer absolute distance. Assuming we have a blackbody heated to 1273 K and a nominal aperture diameter of 6.4 mm, at a distance of 200 mm, the incident power density will be according to Eq. (2). At such a high-level power density, the DET10D InGaAs detector tends to exhibit nonlinear responsivity according to our previous estimation. With these results in mind, we conduct a measurement to verify our assumption. Fig. 3 shows the measured and calculated response voltage of a DET10D InGaAs detector versus absolute distance. For blackbody temperature of 1273 K and aperture diameter of 6.4 mm, a magnification of 20 is chosen for SR570. Thus the value for constant will be . The gap between measured data and calculated curve at 1273 K does appear at a longer absolute distance and this distance is around 150 mm. These facts confirm our speculation that the DET10D InGaAs detector exhibits a nonlinear responsivity under high-incident power density. In order to examine the situation of the DET10D InGaAs detector under low-incident power density, the response voltage of the DET10D InGaAs detector is measured under the illumination of a 573 K blackbody with an aperture diameter of 1.6 mm. At the blackbody temperature of 573 K, a magnification of 5 is chosen for SR570 and thus the value of constant is . The nonlinear responsivity of the DET10D InGaAs detector under low-incident power density occurs when absolute distance is larger than 125 mm as is shown in Fig. 3. Therefore, the low-power density threshold of nonlinear responsivity for the DET10D InGaAs detector is around estimated according to Eq. (2). It should be noted that the fitting procedure in Fig. 3 uses an offset distance of −448 mm and a correction factor of 1.2 and 1.25 for 1.6 and 6.4 mm aperture respectively.
Figure 3.(Color online) Measured and calculated response voltage of a DET10D InGaAs detector versus absolute distance. Red color shows the experimental and calculated data measured at the blackbody temperature of 1273 K and aperture diameter of 6.4 mm, while blue color corresponds to data obtained at the blackbody temperature of 573 K and aperture diameter of 1.6 mm.
When the nonlinear responsivity of the DET10D InGaAs detector occurs, using Eq. (8) to extract aperture diameter could be difficult. Here we extract aperture diameter according to Eq. (10) and compare correction factors obtained from two methods. Fig. 4 shows the response voltage of the DET10D InGaAs detector versus aperture diameter. Response voltages were measured at an absolute distance of 236 and 389 mm respectively. It should be noted that these two values of absolute distance are calculated based on the previously extracted offset distance of −448 mm. The blackbody is heated to 873 K and the responsivity of the DET10D InGaAs detector is assumed to be 1.3 A/W. A magnification of 5 and 1 is used for the SR570 preamplifier when the DET10D InGaAs detector is at a distance of 236 and 389 mm respectively. Therefore we obtain a value of and for constant at an absolute distance of 236 and 389 mm respectively. In Fig. 4, the squares and solid squares stand for the response voltage plotted with the nominal and corrected aperture diameter respectively and the calculated curves are obtained according to Eq. (10). The correction factor of 1, 1.2, 1.25, 1.25, 1.25, 1.25, 1.25 and 1.24 is used for the nominal aperture diameter of 0.8, 1.6, 3.2, 6.4, 9.5, 12.7, 15.9 and 22.2 mm respectively at both the absolute distances of 236 and 389 mm. Data with corrected aperture diameter fits well with calculated curves at both 236 and 389 mm. The correction factor 1.24 for aperture diameter 22.2 mm obtained from this method is slightly larger than the one obtained according to Eq. (8). The smaller correction factor of 1.18 probably comes from the nonlinear responsivity of the DET10D InGaAs detector.
Figure 4.(Color online) The relationship between response voltage and aperture diameter. Square scatters show the response voltage plotted with a nominal aperture diameter, while solid squares represent experiment data plotted with corrected aperture diameter.
After verifying the above calibration principles, we extend our calibration procedures into an InGaAsSb pin detector fabricated in our laboratory. This detector has a 50% cut-off wavelength of 2.8 at room temperature. More detailed information regarding this detector might be found in our previous work[17]. This InGaAsSb detector is mounted in a cryostat through a 16-pin chip carrier and illuminated by a 973 K blackbody with a nominal aperture diameter of 3.2 mm. A magnification of 50 is specified for the SR570 preamplifier. Since the InGaAsSb detector package is different from that of the DET10D InGaAs detector, the offset distance needs to be recalibrated according to Eq. (8). The change of the DUT should not affect the diameter of the aperture, thus we use a correction factor of 1.25 for the aperture with a nominal diameter of 3.2 mm. The value of constant is . Fig. 5 (left axis) shows the measured and calculated response voltage of the InGaAsSb detector as a function of absolute distance. The calculated response voltage is obtained according to Eq. (8). In the calculation, offset distance and responsivity of the InGaAsSb detector are treated as two fitting parameters to fit measured data. A best fitting yields a responsivity of 0.93 A/W and an offset distance of −421 mm. Moreover, Fig. 5 (right axis) shows the calculated responsivity of the InGaAsSb detector according to Eq. (9) as a function of absolute distance. The only unknown parameter in Eq. (9) is offset distance. Thus we treat offset distance as a fitting parameter. For a given detector, its responsivity should be a constant and does not change with its distance away from the blackbody source. In order to obtain a distance-independent responsivity, a value of −421 mm is set for the offset distance. The calculated responsivity of the InGaAsSb detector in Fig. 5 has a mean value of 0.92 A/W and a standard deviation of 0.044. The responsivity values of the InGaAsSb detector obtained according to Eq. (8) and (9) demonstrate a high consistency.
Figure 5.(Color online) Measured and calculated response voltage (left axis) and the calculated responsivity (right axis) of the InGaAsSb detector as a function of absolute distance.
In conclusion, we present a method to calibrate a responsivity measurement system based on the blackbody source. The distance between the blackbody source and DUT and aperture diameter, most crucial parameters in such a system, are extracted instead of measured directly. Extractions procedures are conducted by measuring the response signal of the DUT as a function of the distance between the blackbody source and DUT and aperture diameter, and then fitting experimental data to Eqs. (8)−(10) with the distance and aperture diameter as fitting parameters. Compared with direct measurement, the extraction method is believed to yield results with higher accuracy. This calibration method is verified with a commercial, extended InGaAs detector at a wide range of blackbody temperatures, aperture diameters and distances. The verification procedure was further extended into a detector fabricated in our laboratory and consistent results were obtained.