
Binhai Yu, Shunming Liang, Fengyi Zhang, Zongtao Li, Bin Liu, Xinrui Ding. Water-stable CsPbBr3 perovskite quantum-dot luminous fibers fabricated by centrifugal spinning for dual white light illumination and communication[J]. Photonics Research, 2021, 9(8): 1559
- Photonics Research
- Vol. 9, Issue 8, 1559 (2021)
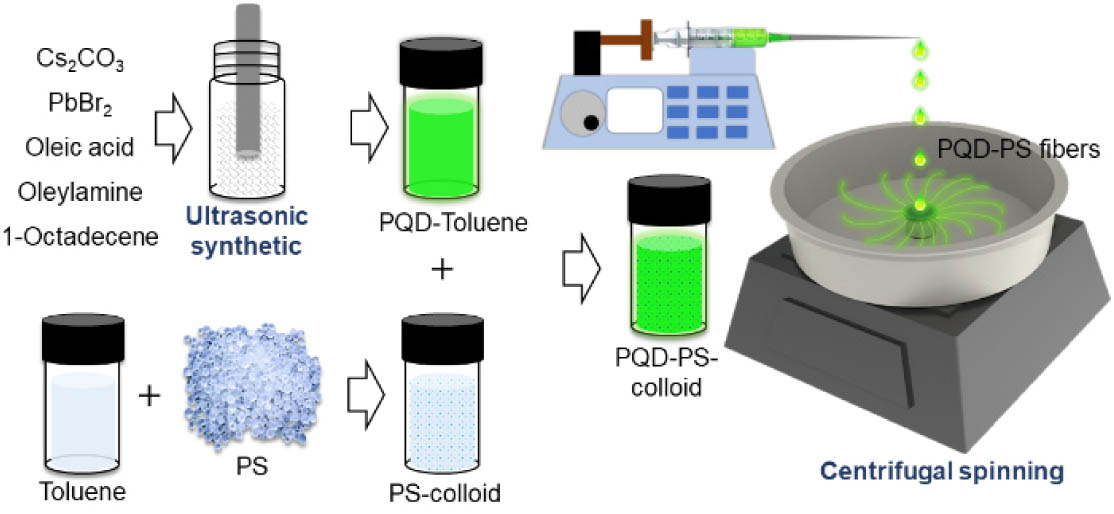
Fig. 1. Schematic diagram of PQD-PS fiber centrifugal spinning.
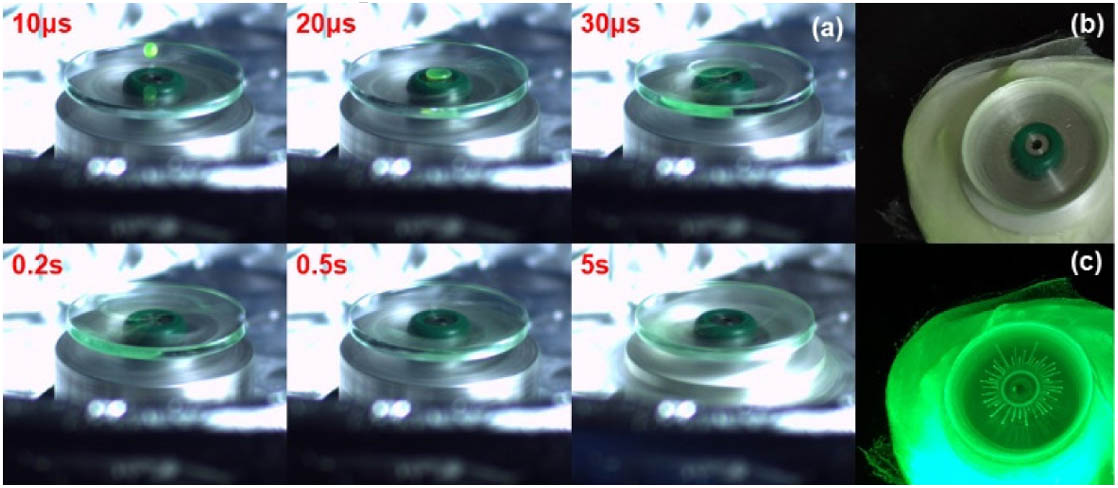
Fig. 2. (a) Centrifugal spinning process. PQD-PS fibers under (b) visible light and (c) UV light.
Fig. 3. (a) Mechanical treatment before PL measurement. (b) Centrifugal spinning fibers and fiber pieces under visible light and UV light. (c) PL measurement setup.
Fig. 4. Experimental setup of the visible light communication system.
Fig. 5. Structural analyses of CsPbBr 3 CsPbBr 3
Fig. 6. (a) SEM image of PQD fibers. (b) XRD patterns of PS and PQD-PS fibers. (c) Time-resolved fluorescence measurement of the PQD-PS fibers (inset: single PQD fiber under ambient light and UV light). (d) Absorption and emission spectra of PQD-PS fibers.
Fig. 7. Emission spectra of PQD-PS fibers after (a) exposure to air and (b) immersion in water for one week. (c) Emission spectra of PQD-PS fibers after immersion in water for 11 months (inset: fibers soaking in water for 11 months under UV light). (d) PL intensity of fibers after stability test. (e) PL peak wavelength trend of PQD-PS fibers during water immersion. (f) PL decay curves of PQD-PS fibers after immersion in water and exposure to air.
Fig. 8. XRD patterns of PQD-PS fibers after (a) immersion in water, (b) exposure to air, and (c) exposure to UV light.
Fig. 9. PQD-PS fibers soaking in hexane under (a) visible light and (b) UV light. PQD-PS fibers after soaking in hexane and ultrasonic treatment under (c) visible light and (d) UV light. Hexane (right) and hexane after ultrasonic treatment (left) under (e) visible light and (f) UV light.
Fig. 10. (a) EL spectrum of QD-based white LEDs. (b) Color coordinates and color gamut of QD-based white LEDs plotted on the CIE1931 chromaticity diagram. (c) Frequency response of the LD, LD + YAG white light, LD + PQD-PS fibers, LD + CdSe/ZnS PDMS film, and LD + PQD-PS + CdSe/ZnS white light. (d) The − 3 dB
|
Table 1. PLQY Stability of PQD-PS Fibers
|
Table 2. PLQY Stability of CsPbBr3 with Different Composites

Set citation alerts for the article
Please enter your email address
© Copyright 2018-2021 | Chinese Laser Press. All Rights Reserved 沪ICP备15018463号-20