• Acta Optica Sinica
  • Vol. 41, Issue 24, 2430001 (2021)
Jinguang Lü1、**, Jingqiu Liang1、*, Weibiao Wang1, Yuxin Qin1、2, and Jin Tao1
Author Affiliations
  • 1State Key Laboratory of Applied Optics, Changchun Institute of Optics, Fine Mechanics and Physics, Chinese Academy of Sciences, Changchun, Jilin 130033, China
  • 2University of Chinese Academy of Sciences, Beijing 100049, China
  • show less
    DOI: 10.3788/AOS202141.2430001 Cite this Article Set citation alerts
    Jinguang Lü, Jingqiu Liang, Weibiao Wang, Yuxin Qin, Jin Tao. Monte Carlo Analysis of Array Non-Uniformity in Snapshot Fourier Transform Imaging Spectrometer[J]. Acta Optica Sinica, 2021, 41(24): 2430001 Copy Citation Text show less
    Principle diagram of snapshot Fourier transform imaging spectrometer. (a) Structure; (b) optical path
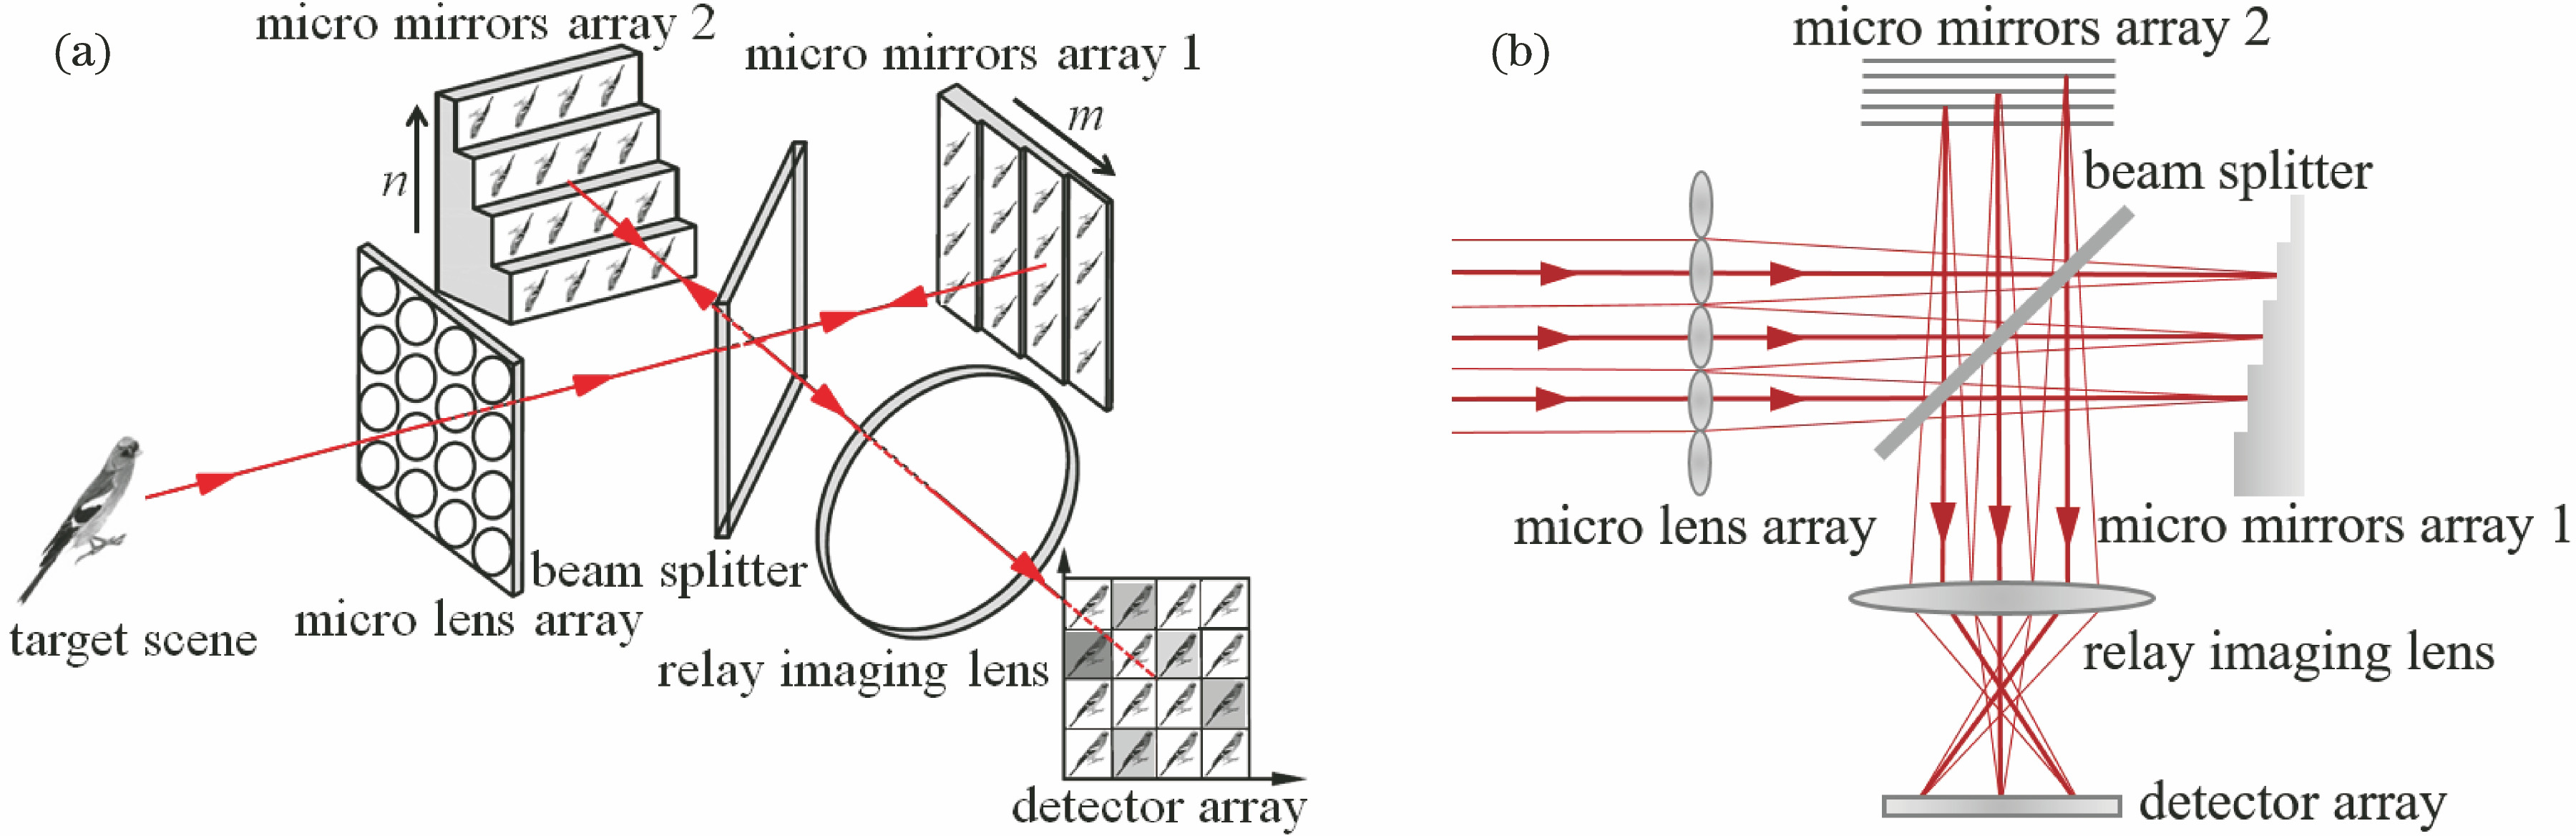
    Fig. 1. Principle diagram of snapshot Fourier transform imaging spectrometer. (a) Structure; (b) optical path
    Interferogram sequences and recovered spectra corresponding to different focal length standard deviations. (a) Interferogram for σf=0 mm; (b) spectrum for σf=0 mm; (c) interferogram for σf=2 mm; (d) spectrum for σf=2 mm
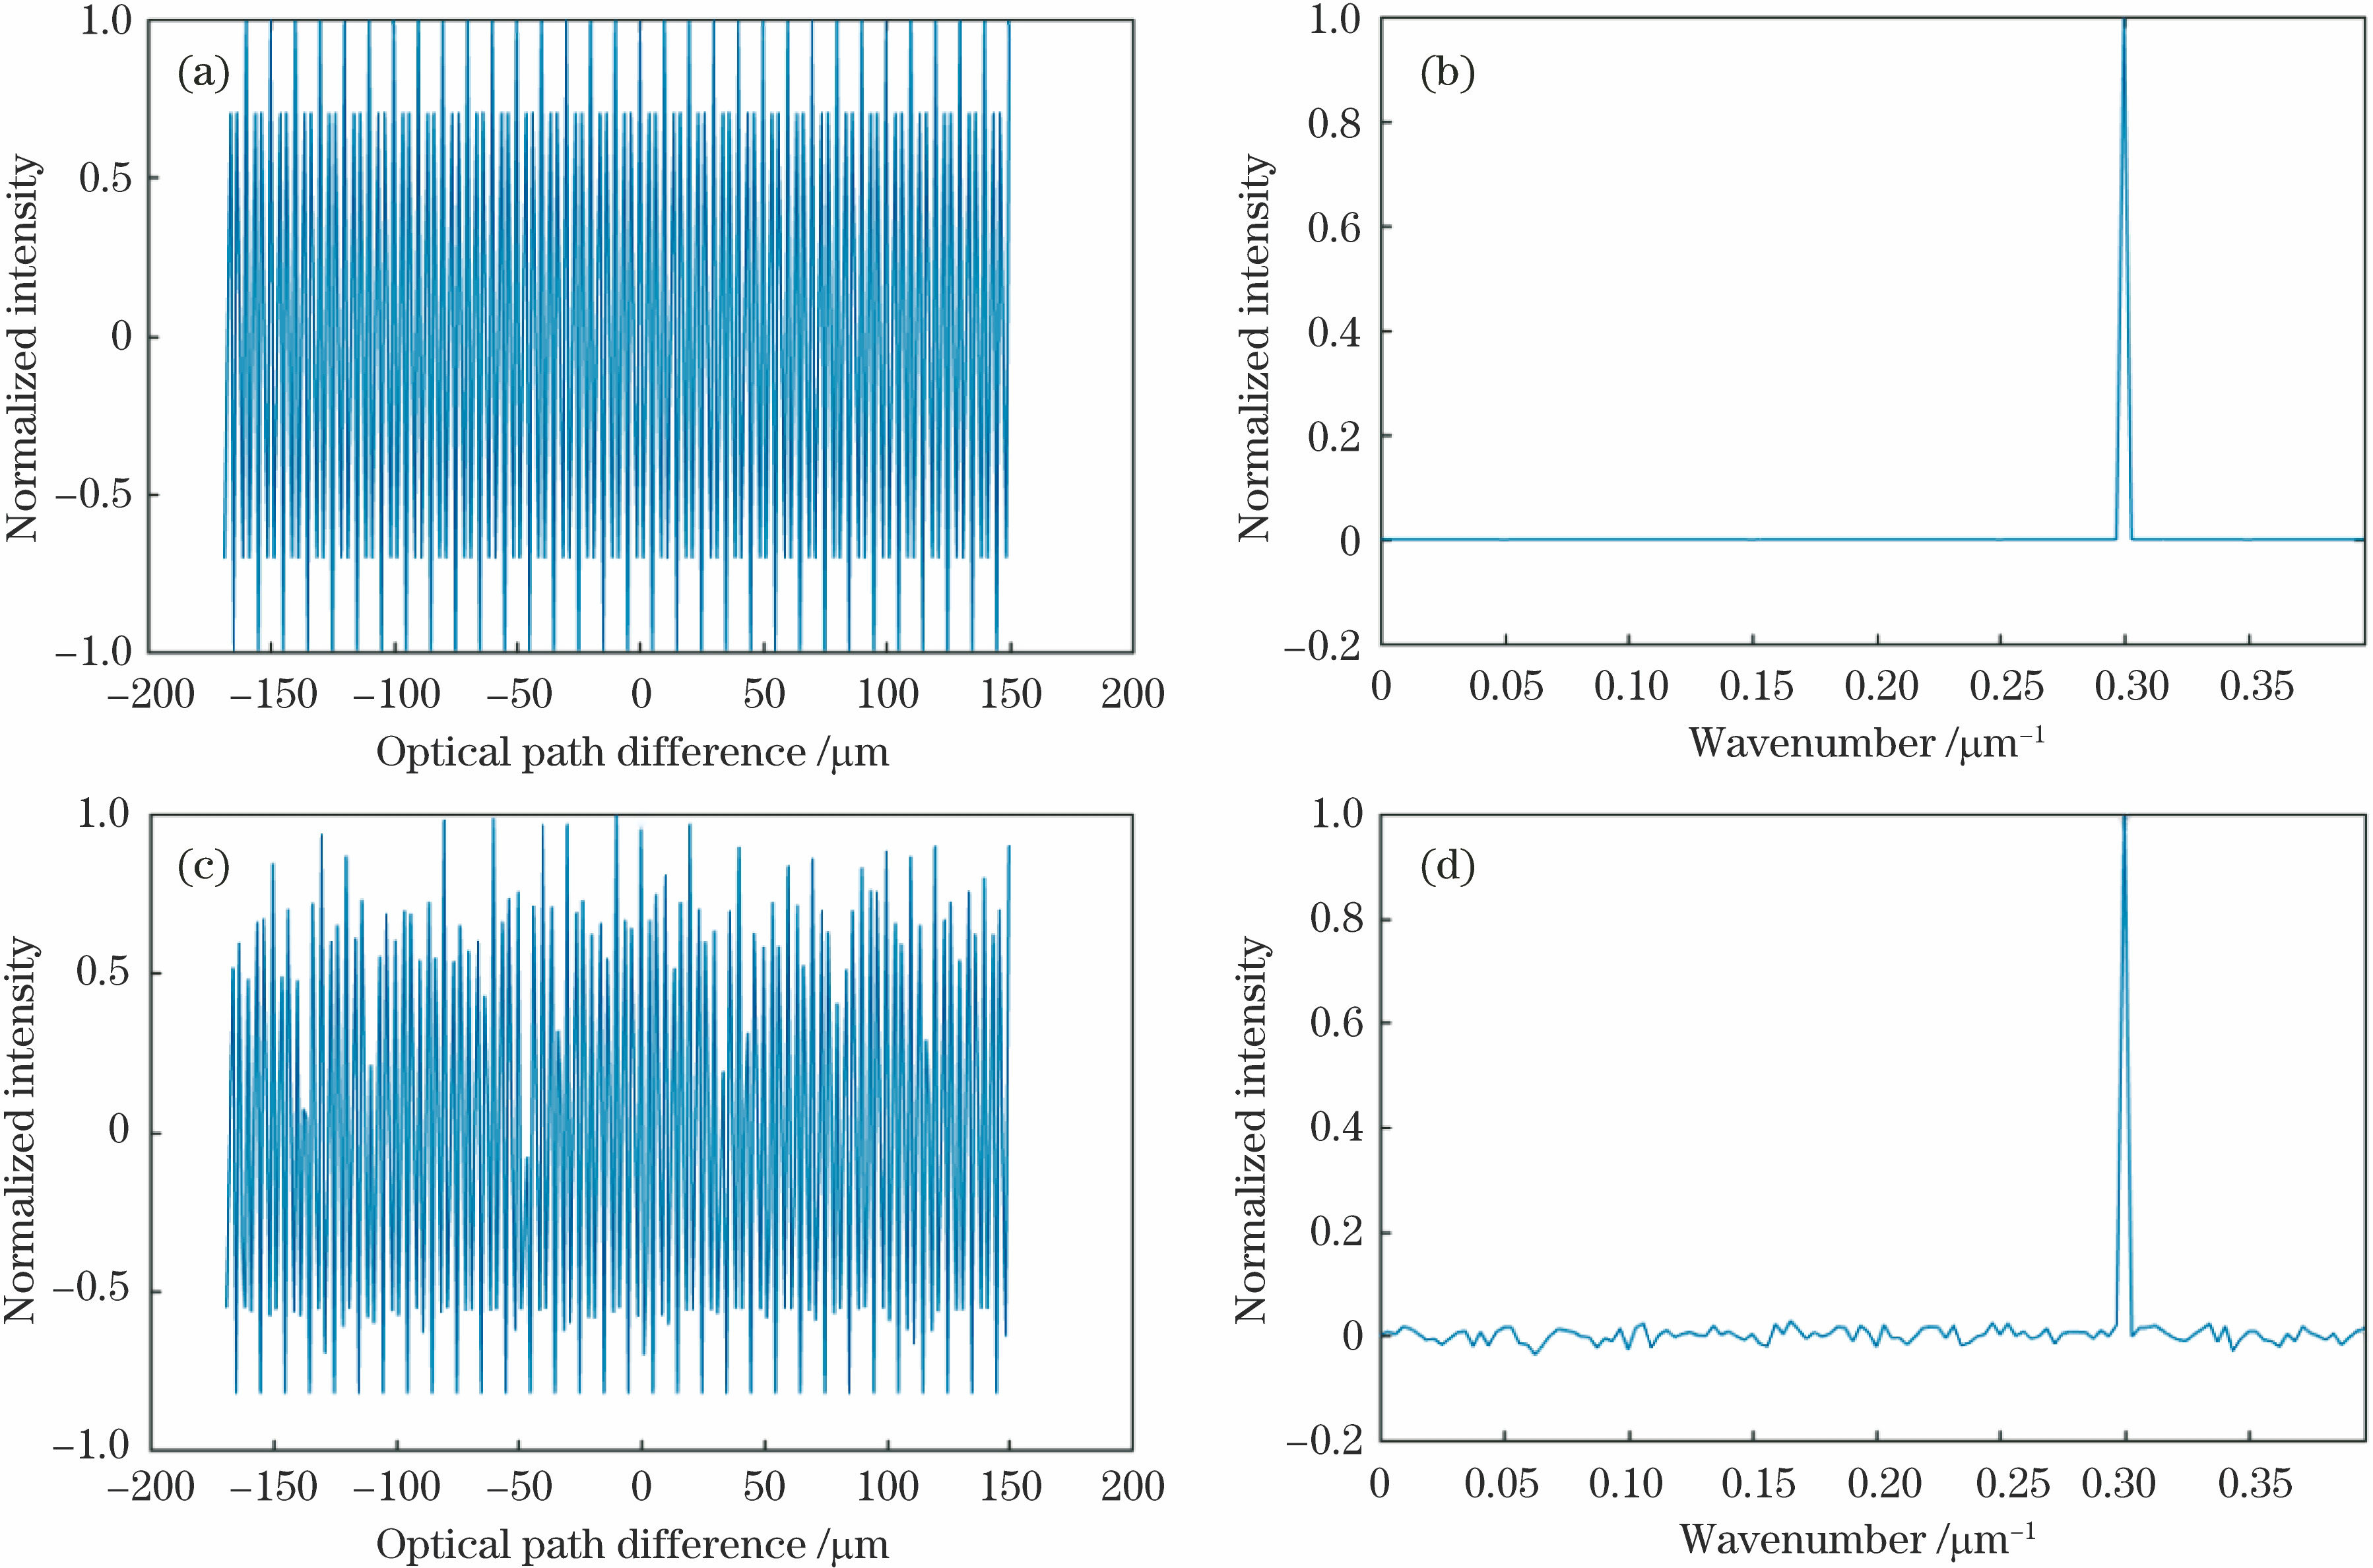
    Fig. 2. Interferogram sequences and recovered spectra corresponding to different focal length standard deviations. (a) Interferogram for σf=0 mm; (b) spectrum for σf=0 mm; (c) interferogram for σf=2 mm; (d) spectrum for σf=2 mm
    Interval frequency count distribution of relative spectrum error
    Fig. 3. Interval frequency count distribution of relative spectrum error
    Relationship of relative spectrum error with focal length standard deviation
    Fig. 4. Relationship of relative spectrum error with focal length standard deviation
    Recovered spectra corresponding to different step length standard deviations. (a) Zero step error; (b) single transverse step error; (c) single longitudinal step error; (d) total step error
    Fig. 5. Recovered spectra corresponding to different step length standard deviations. (a) Zero step error; (b) single transverse step error; (c) single longitudinal step error; (d) total step error
    Interval frequency count distributions of relative spectrum error. (a) Single transverse step error; (b) single longitudinal step error; (c) total step error
    Fig. 6. Interval frequency count distributions of relative spectrum error. (a) Single transverse step error; (b) single longitudinal step error; (c) total step error
    Relationship of relative spectrum error with step length standard deviation
    Fig. 7. Relationship of relative spectrum error with step length standard deviation
    Relative spectrum error versus step length standard deviation after phase compensation correction
    Fig. 8. Relative spectrum error versus step length standard deviation after phase compensation correction
    Jinguang Lü, Jingqiu Liang, Weibiao Wang, Yuxin Qin, Jin Tao. Monte Carlo Analysis of Array Non-Uniformity in Snapshot Fourier Transform Imaging Spectrometer[J]. Acta Optica Sinica, 2021, 41(24): 2430001
    Download Citation