• Photonics Research
  • Vol. 10, Issue 2, 407 (2022)
Yunho Shin1, Yingfei Jiang1, Qian Wang1, Ziyuan Zhou1, Guangkui Qin2, and Deng-Ke Yang1、3、*
Author Affiliations
  • 1Materials Science Program, Advanced Materials and Liquid Crystal Institute, Kent State University, Kent, Ohio 44242, USA
  • 2BOE Technology Group Co., Beijing, China
  • 3Department of Physics, Kent State University, Kent, Ohio 44242, USA
  • show less
    DOI: 10.1364/PRJ.426780 Cite this Article Set citation alerts
    Yunho Shin, Yingfei Jiang, Qian Wang, Ziyuan Zhou, Guangkui Qin, Deng-Ke Yang. Flexoelectric-effect-based light waveguide liquid crystal display for transparent display[J]. Photonics Research, 2022, 10(2): 407 Copy Citation Text show less
    Schematic diagram of the light waveguide LCD based on the flexoelectric effect. (a) Homogeneous state, (b) striped state, and (c) random polydomain state.
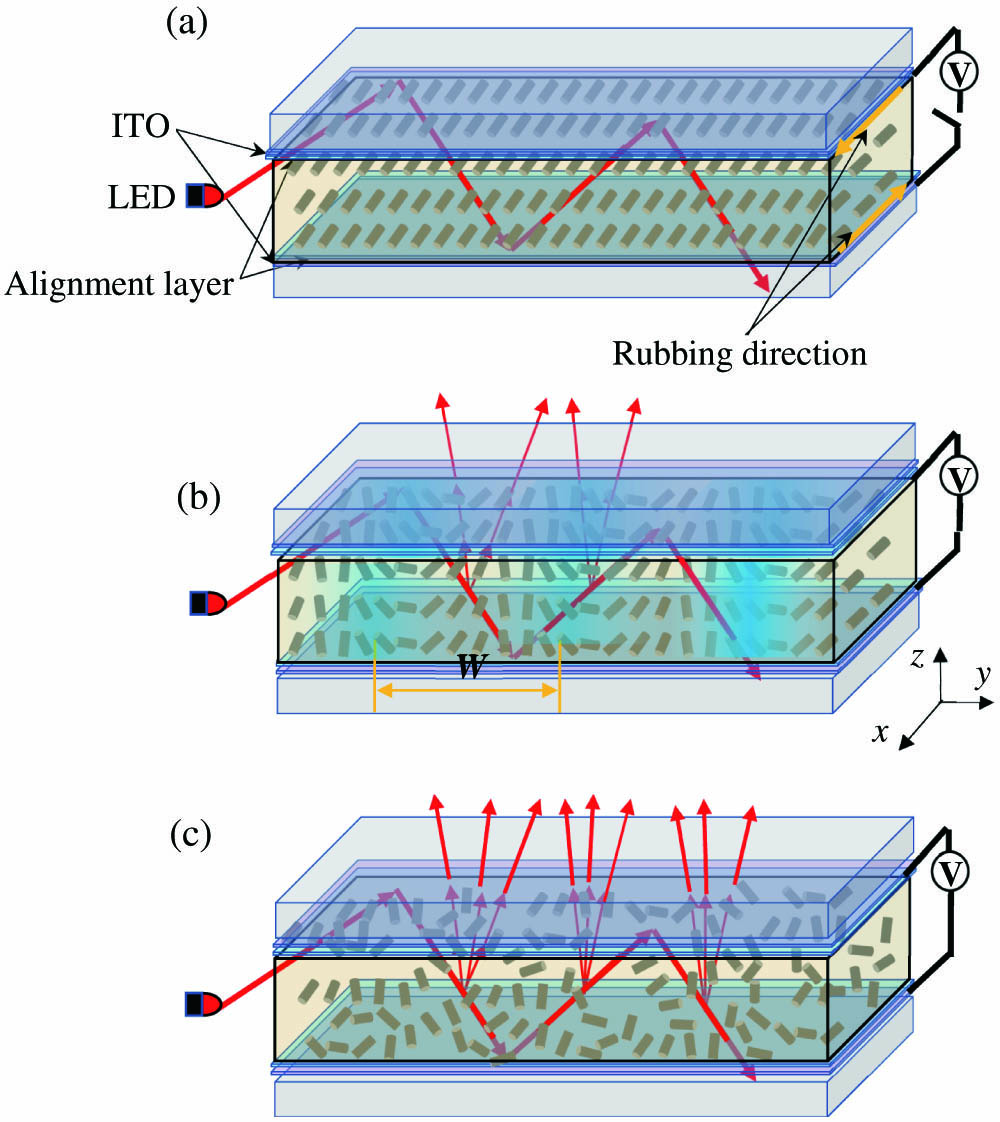
    Fig. 1. Schematic diagram of the light waveguide LCD based on the flexoelectric effect. (a) Homogeneous state, (b) striped state, and (c) random polydomain state.
    Chemical structure of liquid crystal dimers CB7CB and CB9CB.
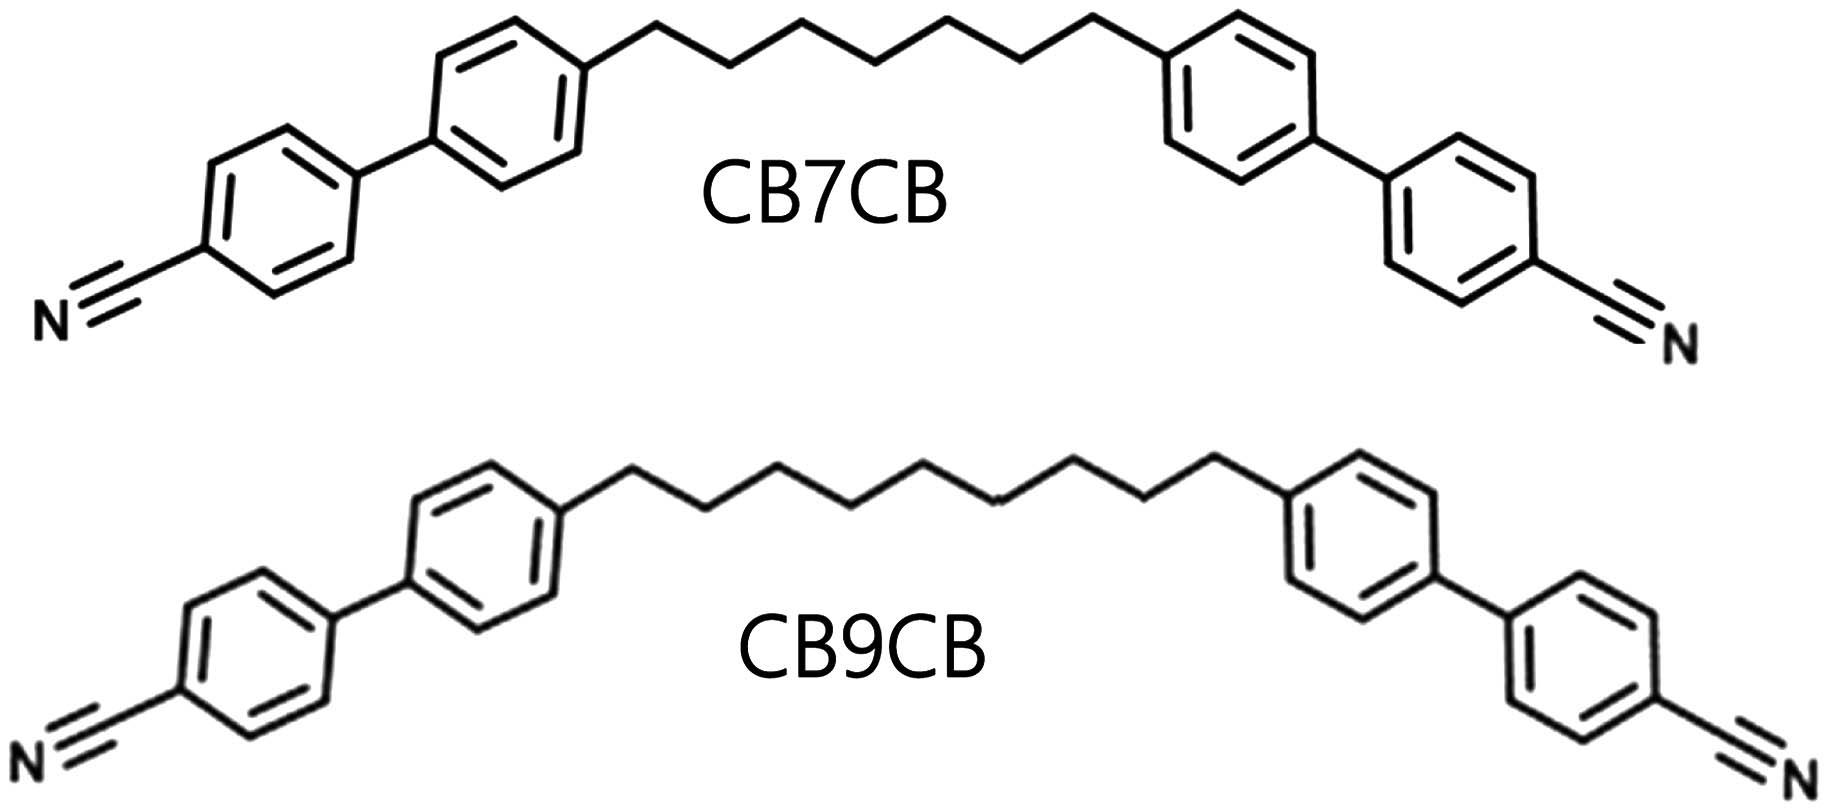
    Fig. 2. Chemical structure of liquid crystal dimers CB7CB and CB9CB.
    Polarizing optical microphotographs of the waveguide LCD under various applied voltages. The frequency of the applied voltage is 30 Hz.
    Fig. 3. Polarizing optical microphotographs of the waveguide LCD under various applied voltages. The frequency of the applied voltage is 30 Hz.
    Photographs of the waveguide LCD under various applied voltages. The frequency of the applied voltage is 30 Hz.
    Fig. 4. Photographs of the waveguide LCD under various applied voltages. The frequency of the applied voltage is 30 Hz.
    Outgoing light intensity of the waveguide display versus applied voltage with different frequencies.
    Fig. 5. Outgoing light intensity of the waveguide display versus applied voltage with different frequencies.
    Outgoing light intensity of the waveguide display versus time under 100 ms AC voltage pulse. The amplitude of voltage is 15 V, and the frequency of the voltage is 20 ms.
    Fig. 6. Outgoing light intensity of the waveguide display versus time under 100 ms AC voltage pulse. The amplitude of voltage is 15 V, and the frequency of the voltage is 20 ms.
    Outgoing light intensity of the waveguide display versus applied voltage with the LED installed on different edges. (a) LED installed on the edge parallel to the stripe. (b) LED installed on the edge perpendicular to the stripe.
    Fig. 7. Outgoing light intensity of the waveguide display versus applied voltage with the LED installed on different edges. (a) LED installed on the edge parallel to the stripe. (b) LED installed on the edge perpendicular to the stripe.
    Photographs of the waveguide display. (a) Transparent state in transparent display mode when applied voltage is 0. (b) Bright state in transparent display mode when applied voltage is 15 V. (c) Dark state in direct view display mode when applied voltage is 0. (d) Bright state in direct view display mode when applied voltage is 15 V.
    Fig. 8. Photographs of the waveguide display. (a) Transparent state in transparent display mode when applied voltage is 0. (b) Bright state in transparent display mode when applied voltage is 15 V. (c) Dark state in direct view display mode when applied voltage is 0. (d) Bright state in direct view display mode when applied voltage is 15 V.
    Yunho Shin, Yingfei Jiang, Qian Wang, Ziyuan Zhou, Guangkui Qin, Deng-Ke Yang. Flexoelectric-effect-based light waveguide liquid crystal display for transparent display[J]. Photonics Research, 2022, 10(2): 407
    Download Citation