
Yunho Shin, Yingfei Jiang, Qian Wang, Ziyuan Zhou, Guangkui Qin, Deng-Ke Yang, "Flexoelectric-effect-based light waveguide liquid crystal display for transparent display," Photonics Res. 10, 407 (2022)
- Photonics Research
- Vol. 10, Issue 2, 407 (2022)
Abstract
1. INTRODUCTION
Transparent displays [1–7] have emerged as a class of next-generation optoelectronics with the development of smart devices and the Internet of Things (IoT) [8,9], such as smart windows [10–13], augmented reality (AR) displays [14–16], and head-up displays (HUDs) [17–19]. As a powerful medium, transparent display, showing visual information on transparent screens without affecting their original appearance and functionality, offers new opportunities to visually communicate. A number of different display technologies have developed to meet the growing demands of transparent displays, including the conventional liquid crystal display (LCD) [20–25], polymer network liquid crystal (PNLC) [26–28]/polymer dispersed liquid crystal display (PDLC) [29–32], organic light-emitting display (OLED) [33–36], mini/micro light-emitting display (mini/micro-LED) [37–39], and electrochromic display (EC) [40–42]. Among the types of displays, LCDs are still the leading technology in flat panel displays and are widely used in many applications due to their advantages such as high resolution, light weight, low manufacturing cost, and long lifespan. In a conventional LCD, light is produced by a backlight (or edgelight) source, which is usually light-emitting diodes (LEDs). The brightness of the pixels (display unit) of the display is controlled by the liquid crystal layer through the help of polarizers. Color images are displayed through the use of color filters. The polarizers and color filters absorb more than 90% of the light produced by the backlight, and therefore the energy efficiency of conventional LCDs is very low. When a conventional LCD with an edgelight is used for transparent display, the transmittance of the transparent state is less than 10%, which is undesirable.
An emerging liquid crystal display technology is the light waveguide liquid crystal display [43–47]. It consists of two parallel flat substrates with a layer of polymer stabilized liquid crystal sandwiched between them. The polymer stabilized liquid crystal is a composite of a liquid crystal and an anisotropic polymer network. An LED is installed on the edge of the display, and the produced light is coupled into the flat display system. When no voltage is applied, the liquid crystal is uniformly aligned and is transparent. The incident light bounces back and forth from the substrate–air interface due to total internal reflection (TIR), and it propagates through the display. No light comes out of the viewing side of the display. When a voltage is applied, the liquid crystal is switched into a micrometer-sized polydomain state due to the competition between the aligning effect of the applied voltage under dielectric interaction and the aligning effect of the dispersed polymer network. The liquid crystal becomes optically scattering. The incident light is scattered out of the waveguide propagation mode and comes out of the viewing side of the display. The operation of this display does not need polarizers. Furthermore, it has an ultrafast submillisecond switching time, making it possible to show colored images by using a color sequential scheme. The transmittance of the transparent state (voltage-off state) is very high, near 90%, making it an excellent candidate for transparent display. There is, however, a problem with the polymer stabilized liquid crystal that it exhibits some residual light scattering due to the following two issues. First, it is difficult to perfectly match the refractive indices of the liquid crystal and polymer network. Second, once the liquid crystal is switched to the polydomain state under an applied voltage, it may not be able to relax to the initial orientation, even if the applied voltage is removed. The residual scattering does not much affect the transmittance of the voltage-off state, but it has a significant impact on the contrast ratio (CR) of the display, namely, the ratio between the brightness of the bright state (voltage-on state) and dark state (voltage-off state). The contrast ratio of light waveguide LCDs is usually less than 50:1.
In this paper we report a light waveguide LCD based on the flexoelectric effect. In this new display, there is no dispersed polymer. The light scattering polydomain state is produced by the flexoelectric effect. There is no residual scattering, and therefore the display has ultrahigh transmittance and high contrast ratio.
Sign up for Photonics Research TOC. Get the latest issue of Photonics Research delivered right to you!Sign up now
2. DISPLAY DESIGN AND OPERATION PRINCIPLE
The flexoelectric-based waveguide LCD is schematically shown in Fig. 1. It consists of two parallel glass substrates with a layer of liquid crystal (LC) sandwiched between them. On the inner surface of the substrate there is an indium-tin-oxide (ITO) coating, which serves as the transparent electrode. On top of the ITO there is a homogeneous alignment layer, which controls the orientation of the liquid crystal in the voltage-off state. The rubbing directions of the top and bottom alignment layer are antiparallel in the
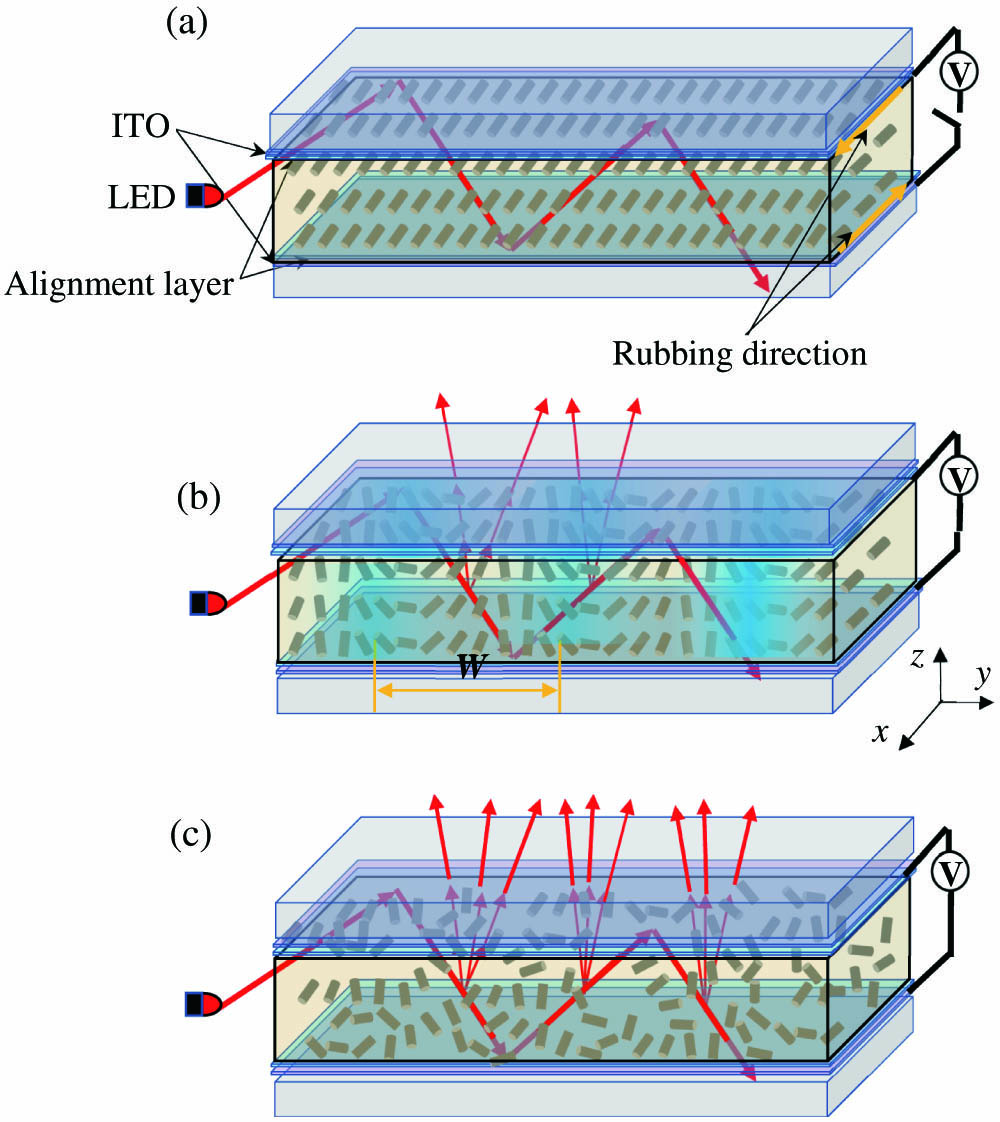
Figure 1.Schematic diagram of the light waveguide LCD based on the flexoelectric effect. (a) Homogeneous state, (b) striped state, and (c) random polydomain state.
When no voltage is applied, the LC is uniformly aligned along the rubbing direction—the
When a voltage is applied across the cell in the
When the flexoelectric undulation occurs, on the one hand, the electric energy of the system is decreased. On the other hand, the elastic energy of the system is increased, which is described by
For the LC used in our experiment, the dielectric anisotropy is small and the dielectric interaction is negligible. We consider the reorientation of the LC under the flexoelectric interaction. As an approximation we also neglect the variation of the LC director in the
When a voltage
If
The average (averaged over one period in the
We minimize the average free energy density with respect to the wave vector
We get
The width of the stripe is
The width
The direction of the splay-bend deformation is sensitive to the polarity of the applied voltage, which can be seen from Eq. (3). When a low-frequency AC voltage is applied and the applied voltage is low, the magnitude of the deformation is small; the splay-bend deformation switches between the up and down directions following the switch of the polarity of the applied voltage changes. The LC is in the periodic striped state as shown in Fig. 1(b) and becomes optically diffracting. Some of the incident light is diffracted out of the waveguide mode and comes out of the viewing side of the display. When the applied voltage is high, the amplitude of the splay-bend deformation becomes large and the direction of the deformation cannot follow the polarity of the applied voltage changes, and then the LC is switched to a polydomain structure as shown in Fig. 1(c). The LC becomes optically scattering. The incident light is scattered out of the waveguide mode and comes out of the viewing side of the display.
3. EXPERIMENT AND RESULTS
The display cell used in our experiment consists of two glass substrates with ITO coating. The inner surfaces of the substrates are coated with the alignment material PI2170 (Nissan Chemical Industries, Ltd.), which is baked and rubbed for homogeneous alignment of the liquid crystals. The cell thickness is controlled by 2 μm spacers.
In order to achieve low driving voltages, the liquid crystal should have large flexoelectric coefficients. As discussed in the previous section, LC molecules with a “pear” shape and a permanent dipole parallel to the long molecular axis usually have large splay flexoelectric coefficients, and LC molecules with a “banana” shape and a permanent dipole perpendicular to the long molecular axis have large bend flexoelectric coefficients. In the construction of the LC for the display, three important physical properties must be considered. First, the LC must have large flexoelectric coefficients. Second, the LC should have a small dielectric anisotropy, such that the flexoelectric interaction is dominant. Third, the LC must be in nematic phase at room temperature. In our experiment we used liquid crystal dimers CB7CB and CB9CB, whose chemical structure is shown in Fig. 2. They consist of two mesogenic groups at the two ends and a flexible hydrocarbon chain in the middle. Because the number of carbons in the hydrocarbon chain is odd, they have a bent shape. Furthermore, the mesogenic groups have a cyano group that has a permanent dipole. These dimers have large flexoelectric coefficients. The flexoelectric coefficient of CB7CB is
![]()
Figure 2.Chemical structure of liquid crystal dimers CB7CB and CB9CB.
The response of the sample to applied voltages was studied under a Nikon polarizing optical microscope. The results are shown in Fig. 3. When the applied voltage is below 5.2 V (the threshold voltage), the LC remains in the homogeneous state. The polarizer is parallel to the alignment layer rubbing direction. The polarization of the incident light is parallel to the LC. When it propagates through the LC, its polarization remains unchanged. It is then absorbed by the analyzer. The sample appears black as shown in Fig. 3(a). When the applied voltage is increased above the threshold voltage, the splay-bend stripes start to form. At 8 V, the amplitude of the undulation is small, and the stripes are barely observable as shown in Fig. 3(b). As the applied voltage is increased more, the amplitude of the undulation increases. At 10 V, the stripes can be clearly observed as shown in Fig. 3(c). When the applied voltage is increased further, the width of the stripes becomes narrower and the stripes start to wiggle as shown in Fig. 3(d) where the applied voltage is 11 V. When the applied voltage is increased to 15 V, the stripes are broken into multiple domains as shown in Fig. 3(e).
![]()
Figure 3.Polarizing optical microphotographs of the waveguide LCD under various applied voltages. The frequency of the applied voltage is 30 Hz.
The display was then studied under room light as shown in Fig. 4(a). A black absorbing layer was placed beneath the display to increase the contrast. The frequency of the applied voltage is 30 Hz. When no voltage is applied, the LC is in the homogeneous state. The sample does not reflect light and appears black as shown in Fig. 4(b). When the applied voltage is 10 V, the periodic splay-bend stripes are formed. The LC forms a grating, due to the periodic variation of the refractive index, which diffracts light. The sample becomes colorful as shown in Fig. 4(c). When light is diffracted from different parts of the sample, the diffraction angles are different. Therefore, different parts of the sample exhibit different colors. When the applied voltage is varied in the region between 10 and 13 V, the stripe width decreases with increasing voltage, and the color of the light diffracted from the sample changes as shown in Figs. 4(d) and 4(e). When the applied voltage is increased to 15 V, the LC is switched to the polydomain state and the periodicity is lost. The LC scatters light, which is wavelength independent. Therefore, the sample appears white as shown in Fig. 4(f).
![]()
Figure 4.Photographs of the waveguide LCD under various applied voltages. The frequency of the applied voltage is 30 Hz.
The electro-optical property was then measured. In the experiment, a white LED was installed on the edge of the display perpendicular to the alignment layer rubbing direction. The incident light propagates in the direction parallel to the rubbing direction. The light intensity coming out of the viewing side of the display was measured as a function of applied voltage. The result is shown in Fig. 5 (see
![]()
Figure 5.Outgoing light intensity of the waveguide display versus applied voltage with different frequencies.
Now we consider the frequency dependence. When the frequency is low, the driving voltage is low, and the maximum light intensity is also low. When the frequency is increased, the maximum light intensity increases, and the driving voltage also increases. The increase of the threshold voltage with the frequency is not well understood at this moment. The increase of the light intensity with the frequency is caused by the dynamic behavior of the reorientation of the liquid crystal, which will be discussed in detail in the next paragraph. The optimum frequency is about 50 Hz, where the maximum light intensity is high. The contrast ratio between the outgoing light intensities of the bright state and dark state is high, about 184:1. The threshold voltage is 7 V, and the driving voltage (saturation voltage) for the maximum light intensity is 15 V. The difference between the saturation voltage and threshold voltage is 8 V, which is suitable for thin-film-transistor active matrix driving. Furthermore, in LCD driving, the voltage is alternated between a positive voltage and a negative voltage with the same amplitude in each picture frame. The picture frame time is usually in the range from 10 to 20 ms, corresponding to the frequencies of 100 Hz and 50 Hz, respectively. When the frequency of the applied voltage is 1 kHz, the outgoing light intensity is 0 and does not change with the applied voltage, due to the limited reorienting time of the LC. At this high frequency, the LC cannot rotate to follow the temporal variation of the voltage.
We studied the dynamic response of the waveguide display. In the study, an AC square voltage pulse is applied. The frequency of the voltage is 50 Hz, and the amplitude of the voltage is 15 V. The width of the pulse is 300 ms. The outgoing light intensity as a function of time is shown in Fig. 6 (see
![]()
Figure 6.Outgoing light intensity of the waveguide display versus time under 100 ms AC voltage pulse. The amplitude of voltage is 15 V, and the frequency of the voltage is 20 ms.
The electro-optical property of the waveguide display also depends on the incident light propagation direction with respect to the direction of the flexoelectric stripe, which is controlled by the rubbing direction of the alignment layer. The flexoelectric stripe is parallel to the rubbing direction of the alignment layer. In the measurement of the outgoing light intensity presented in Figs. 5 and 6, the LED is installed on the edge perpendicular to the alignment layer rubbing direction. We made another display where the LED is installed on the edge parallel to the rubbing direction. The result is shown by curve (a) in Fig. 7. For comparison, the result for the display where the LED is installed on the edge perpendicular to the rubbing direction is shown by curve (b) in Fig. 7. For the display with the LED installed on the edge parallel to the rubbing direction, the incident light propagates in directions more or less perpendicular to the flexoelectric stripe. When the incident light propagates through the LC, the encountered refractive index varies more, and therefore the maximum outgoing light intensity is higher. The trade-off is that the minimum outgoing light intensity in the voltage-off state is also higher, which causes the contrast ratio to decrease to 44:1. For the display with the LED installed on the edge perpendicular to the rubbing direction, the incident light propagates in directions more or less parallel to the flexoelectric stripe. When the incident light propagates through the LC, the encountered refractive index varies less, and therefore the maximum outgoing light intensity is lower. The minimum outgoing light intensity in the voltage-off state is also lower, resulting in a contrast ratio of 184:1.
![]()
Figure 7.Outgoing light intensity of the waveguide display versus applied voltage with the LED installed on different edges. (a) LED installed on the edge parallel to the stripe. (b) LED installed on the edge perpendicular to the stripe.
We fabricated a flexoelectric waveguide display with ITO electrode patterned to display the characters of “LCI.” The dimensions of the display are
![]()
Figure 8.Photographs of the waveguide display. (a) Transparent state in transparent display mode when applied voltage is 0. (b) Bright state in transparent display mode when applied voltage is 15 V. (c) Dark state in direct view display mode when applied voltage is 0. (d) Bright state in direct view display mode when applied voltage is 15 V.
4. DISCUSSION AND CONCLUSION
Waveguide liquid crystal displays are based on light scattering and do not need polarizers. They have very high transmittance in the voltage-off state, which is a significant advantage over conventional LCDs where polarizers are needed. They are very suitable for transparent displays, which can be used for projection displays, AR displays, and HUDs for automobiles, trains, and airplanes.
There are two types of waveguide liquid crystal displays. The first type is based on polymer stabilized liquid crystal, where the scattering polydomain structure is caused by the dispersed polymer network. The second type is based on the flexoelectric effect reported in this paper. The first type has very fast switching time; both turn-on and turn-off times are in the submillisecond range, with which a color-sequential scheme can be used to display full color images. Its driving voltage is compatible with the amorphous silicon-based active matrix (AM) driving method for multiplex pixel displays. However, it has a drawback that there is some residual scattering in the voltage-off state, caused by slight refractive index mismatch between the LC and the dispersed polymer network, which limits its contrast ratio. The second type uses a homogeneous LC, and there is almost no scattering in the voltage-off state, and thus the display has a very high contrast ratio. Its driving voltage is about the same as that of the first type. The disadvantage is its turn-off time, which is too slow for the color sequential scheme. A main reason responsible for the slow turn-off time is its viscosity. The dimers used to increase the flexoelectric coefficient are large molecules. Doping the dimers into the LC significantly increases the viscosity.
The light scattering in the flexoelectric effect based waveguide display depends on the polydomains formed under flexoelectric interaction. The scattering of one domain may change with time. In displays, the volume of a pixel is typically about
There are other types of scattering liquid crystal technologies, such as dynamic scattering and polymer dispersed liquid crystal (PDLC). The dynamic scattering is based on electro-hydrodynamic instability, where a high ion density is required. The ions decrease the resistivity and thus increase power consumption. Furthermore, they also cause electro-chemical reactions and thus cause a long-term instability problem. For PDLC, it is impossible to switch the material to a state that is transparent for the waveguided incident light by applying a voltage across the top and bottom electrodes. Therefore, both dynamic scattering and PDLC are not suitable for waveguide LCDs.
In summary, we developed a flexoelectric-effect-based liquid waveguide LCD. It has a very high transmittance, near 90%, in the voltage-off state. It also has a high contrast ratio. It is very suitable for transparent display applications.
References
[1] J. F. Wager. Transparent electronics. Science, 300, 1245-1246(2003).
[2] C. W. Hsu, B. Zhen, W. Qiu, O. Shapira, B. G. DeLacy, J. D. Joannopoulos, M. Soljačić. Transparent displays enabled by resonant nanoparticle scattering. Nat. Commun., 5, 3152(2014).
[3] A. Moheghi, M. Kashima, Q. Qin, Y. Dong, D.-K. Yang. 54.3: PSCT for switchable transparent liquid crystal displays. SID Symp. Dig. Tech. Pap., 46, 817-820(2015).
[4] Y.-H. Shin, Y. Jin, N.-S. Oh, C.-W. Jeon, S.-B. Kwon. A normally transparent polymer dispersed liquid crystal developed by using a two-step UV exposure method for transparent flexible displays. Sci. Adv. Mater., 8, 369-375(2016).
[5] C. Il Park, M. Seong, M. A. Kim, D. Kim, H. Jung, M. Cho, S. H. Lee, H. Lee, S. Min, J. Kim, M. Kim, J.-H. Park, S. Kwon, B. Kim, S. J. Kim, W. Park, J.-Y. Yang, S. Yoon, I. Kang. World’s first large size 77-inch transparent flexible OLED display. J. Soc. Inf. Disp., 26, 287-295(2018).
[6] S. H. Shin, B. Hwang, Z. J. Zhao, S. H. Jeon, J. Y. Jung, J. H. Lee, B. K. Ju, J. H. Jeong. Transparent displays utilizing nanopatterned quantum dot films. Sci. Rep., 8, 2463(2018).
[7] J. Li, H. K. Bisoyi, J. Tian, J. Guo, Q. Li. Optically rewritable transparent liquid crystal displays enabled by light-driven chiral fluorescent molecular switches. Adv. Mater., 31, 1807751(2019).
[8] Z. L. Wang. Self-powered nanosensors and nanosystems. Adv. Mater., 24, 280-285(2012).
[9] J. Gubbi, R. Buyya, S. Marusic, M. Palaniswami. Internet of Things (IoT): a vision, architectural elements, and future directions. Future Gener. Comput. Syst., 29, 1645-1660(2013).
[10] H.-K. Kwon, K.-T. Lee, K. Hur, S. H. Moon, M. M. Quasim, T. D. Wilkinson, J.-Y. Han, H. Ko, I.-K. Han, B. Park, B. K. Min, B.-K. Ju, S. M. Morris, R. H. Friend, D.-H. Ko. Optically switchable smart windows with integrated photovoltaic devices. Adv. Energy Mater., 5, 1401347(2015).
[11] H. Khandelwal, A. P. H. J. Schenning, M. G. Debije. Infrared regulating smart window based on organic materials. Adv. Energy Mater., 7, 1602209(2017).
[12] D. Ge, E. Lee, L. Yang, Y. Cho, M. Li, D. S. Gianola, S. Yang. A robust smart window: reversibly switching from high transparency to angle-independent structural color display. Adv. Mater., 27, 2489-2495(2015).
[13] Y. Jiang, Y. Shin, D.-K. Yang. Dual-mode switchable liquid-crystal window. Phys. Rev. Appl., 12, 054037(2019).
[14] P. Milgram, H. Takemura, A. Utsumi, F. Kishino. Augmented reality: a class of displays on the reality-virtuality continuum. Proc. SPIE, 2351, 282-292(1995).
[15] H. Huang, H. Hua. High-performance integral-imaging-based light field augmented reality display using freeform optics. Opt. Express, 26, 17578-17590(2018).
[16] R. Talukder, Y. H. Javed, S.-T. Wu. High performance LCD for augmented reality and virtual reality displays. Liq. Cryst., 46, 920-929(2019).
[17] B.-W. Yang. Head-up display for automobile. U.S. patent(1997).
[18] S. Asakawa, H. Tsutsui, Y. Taketomi, E. Okuda. Head up display unit, liquid crystal display panel, and method of fabricating the liquid crystal display panel. U.S. Patent(1999).
[19] M. Homan. The use of optical waveguides in head up display (HUD) applications. Proc. SPIE, 8736, 87360E(2013).
[20] P.-G. De Gennes, J. Prost. The Physics of Liquid Crystals, 83(1993).
[21] L. M. Blinov, V. G. Chigrinov. Electrooptic Effects in Liquid Crystal Materials(1996).
[22] S. E. Hicks, S. P. Hurley, R. S. Zola, D.-K. Yang. Polymer stabilized VA mode liquid crystal display. J. Disp. Technol., 7, 619-623(2011).
[23] D.-K. Yang. Fundamentals of Liquid Crystal Devices(2014).
[24] X. Zhou, G. Qin, Y. Dong, D.-K. Yang. Fast switching and high-contrast polymer-stabilized IPS liquid crystal display. J. Soc. Inf. Disp., 23, 333-338(2015).
[25] M. Kim, H. S. Jin, S. J. Lee, Y.-H. Shin, H. G. Ham, D.-K. Yang, P. J. Bos, J. H. Lee, S. H. Lee. Liquid crystals for superior electro-optic performance display device with power-saving mode. Adv. Opt. Mater., 6, 1800022(2018).
[26] D.-K. Yang. Polymer-stabilized liquid crystal displays. Progress in Liquid Crystal Science and Technology: In Honor of Shunsuke Kobayashi’s 80th Birthday, 597-628(2013).
[27] D. K. Yang, Y. Cui, H. Nemati, X. Zhou, A. Moheghi. Modeling aligning effect of polymer network in polymer stabilized nematic liquid crystals. J. Appl. Phys., 114, 243515(2013).
[28] Y.-H. Shin, N.-S. Oh, S.-B. Kwon. Electro-optical properties of vertically aligned polymer network liquid crystals for normally transparent light shutters. Mol. Cryst. Liq. Cryst., 644, 130-136(2017).
[29] J. W. Doane, A. Golemme, J. L. West, J. B. Whitehead, B.-G. Wu. Polymer dispersed liquid crystals for display application. Mol. Cryst. Liq. Cryst., 165, 511-532(1988).
[30] N.-S. Oh, Y.-H. Shin, H.-Y. Kang, S.-B. Kwon. High performance dye-doped emulsion type PDLC for transmittance variable devices. Mol. Cryst. Liq. Cryst., 644, 137-144(2017).
[31] Y.-H. Shin, N.-S. Oh, S.-B. Kwon. Electro-optical properties of normally transparent polymer dispersed liquid crystal cells with polymer wall and network structure. Mol. Cryst. Liq. Cryst., 647, 415-421(2017).
[32] J. Jiang, G. McGraw, R. Ma, J. Brown, D.-K. Yang. Selective scattering polymer dispersed liquid crystal film for light enhancement of organic light emitting diode. Opt. Express, 25, 3327-3335(2017).
[33] H. Ochi, S. Fujimura, A. Yoshida, T. Miyadera, M. Tsuchida. Flexible OLED displays using plastic substrates. IEEE J. Sel. Top. Quantum Electron., 10, 107-114(2004).
[34] B. Geffroy, R. P. Le, C. Prat. Organic light-emitting diode (OLED) technology: materials, devices and display technologies. Polym. Int., 55, 572-582(2006).
[35] H. S. Shin, J. K. Jeong, Y. G. Mo, D. U. Jin. Organic light emitting display (OLED) and its method of fabrication. U.S. Patent(2010).
[36] T. Tsujimura. OLED Display Fundamentals and Applications(2017).
[37] H.-V. Han, H.-Y. Lin, C.-C. Lin, W.-C. Chong, J.-R. Li, K.-J. Chen, P. Yu, T.-M. Chen, H.-M. Chen, K.-M. Lau, H.-C. Kuo. Resonant-enhanced full-color emission of quantum-dot-based micro LED display technology. Opt. Express, 23, 32504-32515(2015).
[38] T. Wu, C. W. Sher, Y. Lin, C. F. Lee, S. Liang, Y. Lu, S. W. H. Chen, W. Guo, H.-C. Kuo, Z. Chen. Mini-LED and micro-LED: promising candidates for the next generation display technology. Appl. Sci., 8, 1557(2018).
[39] Y. Huang, E. L. Hsiang, M. Y. Deng, S. T. Wu. Mini-LED, micro-LED and OLED displays: present status and future perspectives. Light Sci. Appl., 9, 1(2020).
[40] C. G. Granqvist, A. Azens, A. Hjelm, L. Kullman, G. A. Niklasson, D. Rönnow, M. S. Mattsson, M. Veszelei, G. Vaivars. Recent advances in electrochromics for smart windows applications. Sol. Energy, 63, 199-216(1998).
[41] A. Azens, C. Granqvist. Electrochromic smart windows: energy efficiency and device aspects. J. Solid State Electrochem., 7, 64-68(2003).
[42] S. Lin, X. Bai, H. Wang, H. Wang, J. Song, K. Huang, C. Wang, N. Wang, B. Li, M. Lei, H. Wu. Roll-to-roll production of transparent silver-nanofiber-network electrodes for flexible electrochromic smart Windows. Adv. Mater., 29, 1703238(2017).
[43] X. Zhou, G. Qin, L. Wang, Z. Chen, X. Xu, Y. Dong, A. Moheghi, D.-K. Yang. Full color waveguide liquid crystal display. Opt. Lett., 42, 3706-3709(2017).
[44] L. Wang, N. Jia, L. Duan, T. Sun, Z. Liu, J. Fang, M. Hou, X. Liu, Y. Shi, Y. Li, X. Zhou, Y. Shin, G. Qin, S. Kim, X. Li, Y. Peng, S. Zhang, F. Yang, J. Sun, Q. Liu, B. Kristal, D. Yan. P-89: development of waveguide liquid crystal display for transparent display applications. SID Symp. Dig. Tech. Pap., 50, 1573-1575(2019).
[45] C. Meng, E. Chen, L. Wang, S. Tang, M. Tseng, J. Guo, Y. Ye, Q. F. Yan, H. Kwok. Color-switchable liquid crystal smart window with multi-layered light guiding structures. Opt. Express, 27, 13098-13107(2019).
[46] Y. Shin, Q. Wang, G. Qin, D.-K. Yang. P-82: color flexible waveguide display using polymer stabilized liquid crystal. SID Symp. Dig. Tech. Pap., 51, 1664-1667(2020).
[47] Y. Shin, J. Jiang, G. Qin, Q. Wang, Z. Zhou, D.-K. Yang. Patterned waveguide liquid crystal displays. RSC Adv., 10, 41693-41702(2020).
[48] N. Éber, P. Salamon, Á. Buka. Electrically induced patterns in nematics and how to avoid them. Liq. Cryst. Rev., 4, 101-134(2016).
[49] A. Varanytsia, L.-C. Chien. Giant flexoelectro-optic effect with liquid crystal dimer CB7CB. Sci. Rep., 7, 41333(2017).
[50] Y. Jiang, X. Zhou, Y. Shin, G. Qin, X. Xu, L. Zhou, S. Lee, D.-K. Yang. Image flickering reduction by dimer and polymer stabilization in FFS liquid crystal display. J. Soc. Inf. Disp., 27, 285-294(2019).
[51] G. Babakhanova, Z. Parsouzi, S. Paladugu, H. Wang, Y. A. Nastishin, S. V. Shiyanovskii, S. Sprunt, O. D. Lavrentovich. Elastic and viscous properties of the nematic dimer CB7CB. Phys. Rev. E, 96, 062704(2017).
[52] R. J. Mandle, C. T. Archbold, J. P. Sarju, J. L. Andrews, J. W. Goodby. The dependency of nematic and twist-bend mesophase formation on bend angle. Sci. Rep., 6, 36682(2016).
[53] D.-K. Yang, Y. Shin, Y. Jiang, Q. Wang, Q. Zhou, G. Qin. figshare(2021).
[54] D.-K. Yang, Y. Shin, Y. Jiang, Q. Wang, Q. Zhou, G. Qin. figshare(2021).


Set citation alerts for the article
Please enter your email address

© Copyright 2018-2021 | Chinese Laser Press. All Rights Reserved 沪ICP备15018463号-20