• Laser & Optoelectronics Progress
  • Vol. 59, Issue 13, 1314005 (2022)
Hongling Hou*, Hailing Hao, Lü Ruihu, Yongqiang Zhao, and Changqian Wang
Author Affiliations
  • School of Mechanical Engineering, Shaanxi University of Technology, Hanzhong 723001, Shaanxi , China
  • show less
    DOI: 10.3788/LOP202259.1314005 Cite this Article Set citation alerts
    Hongling Hou, Hailing Hao, Lü Ruihu, Yongqiang Zhao, Changqian Wang. Parameter Optimization and Performance Test of Laser Cutting of Carbon Fiber Reinforced Plastics Based on Response Surface Method[J]. Laser & Optoelectronics Progress, 2022, 59(13): 1314005 Copy Citation Text show less
    Dingdian laser cutting equipment
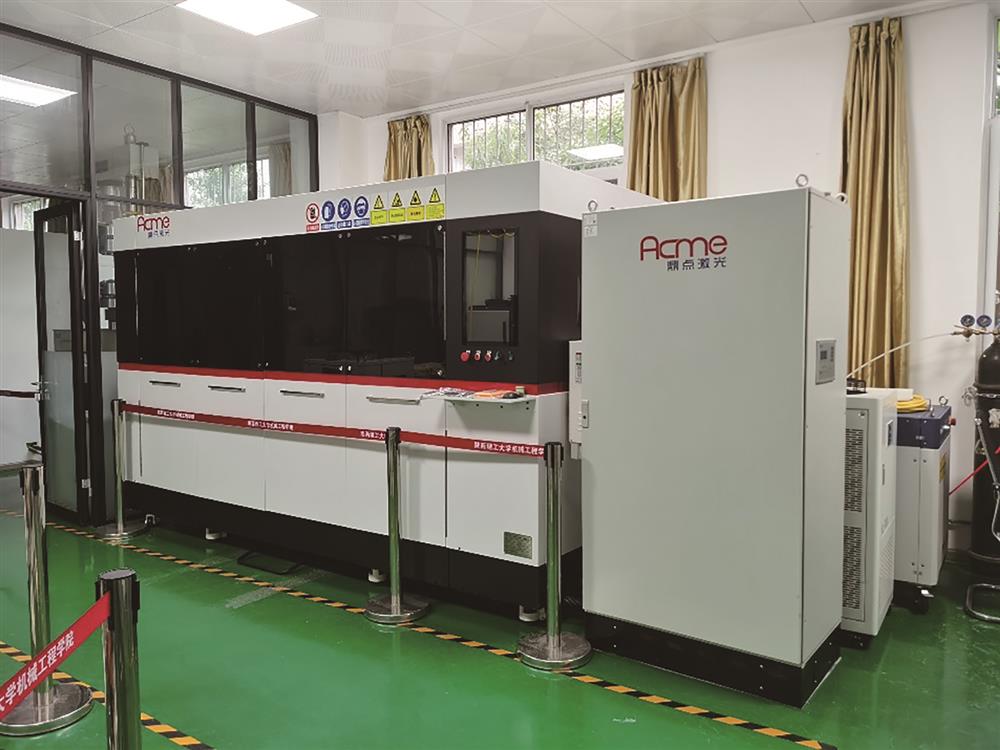
    Fig. 1. Dingdian laser cutting equipment
    Schematic diagram of equal distance marking for cutting seam
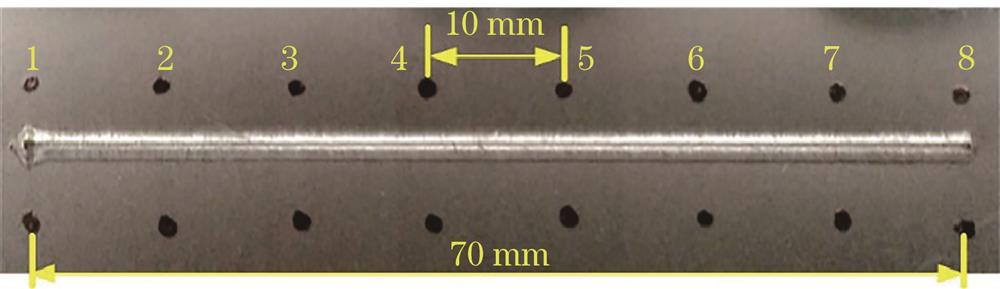
    Fig. 2. Schematic diagram of equal distance marking for cutting seam
    Distributions of predicted and actual values. (a) Cutting entrance width; (b) HAZ width; (c) kerf taper angle
    Fig. 3. Distributions of predicted and actual values. (a) Cutting entrance width; (b) HAZ width; (c) kerf taper angle
    Influence of interaction between laser power and cutting speed on slit entrance width. (a) Response surface; (b) contour map
    Fig. 4. Influence of interaction between laser power and cutting speed on slit entrance width. (a) Response surface; (b) contour map
    Influence of interaction between laser power and cutting speed on HAZ width. (a) Response surface; (b) contour map
    Fig. 5. Influence of interaction between laser power and cutting speed on HAZ width. (a) Response surface; (b) contour map
    Influence of interaction between laser power and cutting speed on kerf taper angle.(a) Response surface; (b) contour map
    Fig. 6. Influence of interaction between laser power and cutting speed on kerf taper angle.(a) Response surface; (b) contour map
    Optimal combination cutting effect. (a) Positive; (b) kerf taper angle
    Fig. 7. Optimal combination cutting effect. (a) Positive; (b) kerf taper angle
    Schematic diagram of specimen bonding and adhesive layer thickness control. (a) Specimen bonding; (b) adhesive layer thickness control
    Fig. 8. Schematic diagram of specimen bonding and adhesive layer thickness control. (a) Specimen bonding; (b) adhesive layer thickness control
    Failure mode of bonded tensile shear specimen. (a) Central test point specimen; (b) parameter optimization combination specimen
    Fig. 9. Failure mode of bonded tensile shear specimen. (a) Central test point specimen; (b) parameter optimization combination specimen
    FactorXLevel
    -101
    Power /WX1700800900
    Speed /(mm·s-1X2202530
    Focus position /mmX3-1.5-1-0.5
    Air pressure /MPaX40.50.60.7
    Table 1. Horizontal coding table
    NumberX1X2X3X4A /WB /(mm·s-1C /mmD /MPaψ /μmH /μmθ /(°)
    1-1-10070020-1.00.6452.451352.043.81
    21-10090020-1.00.6507.741859.203.62
    3-110070030-1.00.6436.781293.724.89
    4110090030-1.00.6489.901732.964.28
    500-1-180025-1.50.5489.961538.624.79
    6001-180025-0.50.5456.201383.184.66
    700-1180025-1.50.7466.921346.884.57
    8001180025-0.50.7444.601311.164.17
    9-100-170025-1.00.5475.021356.324.91
    10100-190025-1.00.5514.421923.404.43
    11-100170025-1.00.7452.841306.324.46
    12100190025-1.00.7488.941712.054.11
    130-1-1080020-1.50.6477.831481.564.28
    1401-1080030-1.50.6456.431393.004.65
    150-11080020-0.50.6472.251353.003.52
    16011080030-0.50.6446.741303.004.58
    17-10-1070025-1.50.6477.321395.804.91
    1810-1090025-1.50.6518.881877.564.56
    19-101070025-0.50.6458.401266.804.51
    20101090025-0.50.6496.881803.354.21
    210-10-180020-1.00.5487.901481.753.88
    22010-180030-1.00.5462.301398.234.60
    230-10180020-1.00.7456.351362.103.49
    24010180030-1.00.7446.701284.504.36
    25000080025-1.00.6461.081339.364.11
    26000080025-1.00.6463.501381.364.18
    27000080025-1.00.6469.801346.454.12
    28000080025-1.00.6472.231339.234.16
    29000080025-1.00.6469.561348.564.09
    30000080025-1.00.6471.621336.354.15
    Table 2. Experimental results
    ParameterPrediction function
    Cutting entrance widthψ=468.27+21.99A-9.63B-9.35C-10.78D+14.89A2-7.12B2
    HAZ width

    H=1352.98+244.7A-40.35B-51.07C-63.20D-16.97AB-40.33AD+29.92CD+

    204.70A2+26.50C2+20.32D2

    Kerf taper angleθ=4.13-0.19A+0.39B-0.17C-0.17D-0.10AB+0.17BC-0.06CD+0.17A2-0.16B2+0.26C2+0.14D2
    Table 3. Prediction function of target response
    Parameter optimization combinationIndex prediction
    Power /WSpeed /(mm·s-1Focus position /mmAir pressure /MPaPredictorPredicted valueFluctuation range
    75520-0.60.7ψ /μm445.02±22.01
    H /μm1299.58±42.68
    θ /(°)3.39±0.18
    Table 4. Parameter optimization combination and index prediction
    Parameterψ /μmH /μmθ /(°)
    Measurement results457.751306.133.51
    Deviation from predicted value12.736.550.12
    Table 5. Measurement results and error of parameter optimization combination test
    Experimental groupCentral test pointParameter optimization combination
    Average /N3938.674837.33
    Serial number123123
    Maximum load /N431631164384485248704790
    Table 6. Maximum load of glued tensile shear damage
    Hongling Hou, Hailing Hao, Lü Ruihu, Yongqiang Zhao, Changqian Wang. Parameter Optimization and Performance Test of Laser Cutting of Carbon Fiber Reinforced Plastics Based on Response Surface Method[J]. Laser & Optoelectronics Progress, 2022, 59(13): 1314005
    Download Citation