
Xiao Wang, Yufeng Qian, JingJing Zhang, Guangdong Ma, Shupeng Zhao, RuiFeng Liu, Hongrong Li, Pei Zhang, Hong Gao, Feng Huang, Fuli Li, "Learning to recognize misaligned hyperfine orbital angular momentum modes," Photonics Res. 9, B81 (2021)
- Photonics Research
- Vol. 9, Issue 4, B81 (2021)
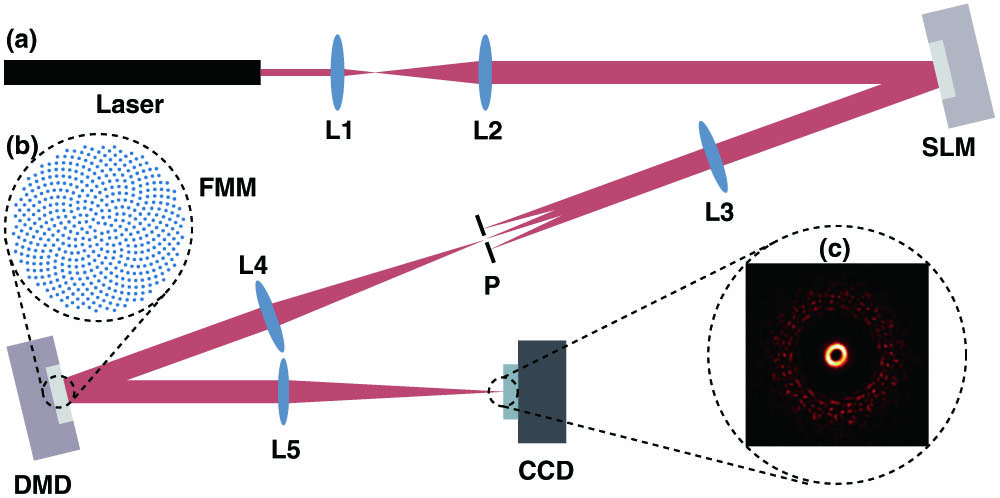
Fig. 1. (a) Alignment-free fractal multipoint interferometer. Laser, He–Ne laser with 633 nm wavelength; L1, 50 mm lens; L2, 500 mm lens; SLM, phase-only spatial light modulator; L3, 300 mm lens; P, pinhole; L4, 300 mm lens; DMD, digital micromirror device; L5, 250 mm lens; CCD, charge-coupled device. (b) proposed FMM; (c) example of the far-field intensity patterns.
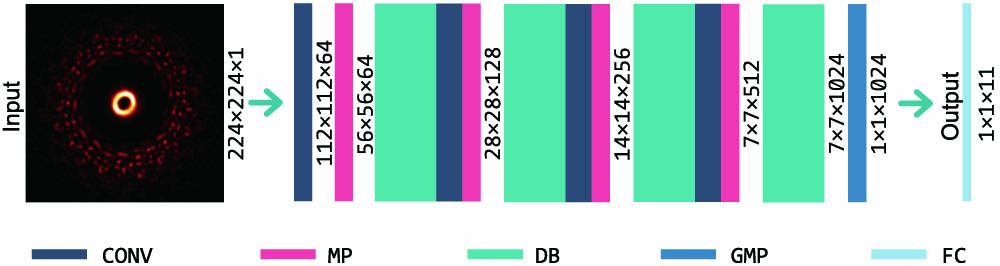
Fig. 2. Schematic diagram of DenseNet-121. CONV, convolution layer; MP, max pooling layer; DB, dense block; GMP, global max pooling layer; FC, fully connected layer.
Fig. 3. Examples of the experimental diffraction intensity patterns for LG eigenstates with topological charge ℓ ∈ { 0 , 1 , ± 2 , 5 } Δ x = Δ y ∈ { 0 , 0.15 , 0.25 } mm ω ∈ [ 0.45 , 0.55 ] mm φ 0 ∈ [ 0 , 2 π ]
Fig. 4. Confusion matrix for the recognition of misaligned LG eigenstates ℓ ∈ { − 5 , − 4 , ⋯ ,5 } p = 0
Fig. 5. Schematic diagram of a Bloch sphere constructed with | ℓ = ± 1 ⟩ | ψ ⟩ ρ A ρ B
Fig. 6. Experimental results of hyperfine LG superposition states. (a)–(c) Examples of the recorded diffraction intensity patterns for OAM superposition states under different misaligned configurations. The collection of each diffraction pattern in the figure is carried out with stochastic disturbances of the other two parameters: (i) beam waist size ω ∈ [ 0.45 , 0.55 ] mm φ 0 ∈ [ 0 , 2 π ] I = 0.3 × max { I } I > 0.3 × max { I }
Fig. 7. Confusion matrix of LG modes with p = 1 ℓ ∈ { − 2 , − 1 , ⋯ ,2 } p = 1 p = 1 p = 0
|
Table 1. Nine Superposition States Combined by


Set citation alerts for the article
Please enter your email address

© Copyright 2018-2021 | Chinese Laser Press. All Rights Reserved 沪ICP备15018463号-20