
Yuyan Zhang, Wei Fang, Chen Li, Yintang Wen. Investigation of Stress Fields in the in situ Manufacturing of Composite Alumina Ceramic Coatings by Laser Cladding[J]. Laser & Optoelectronics Progress, 2023, 60(9): 0931001
- Laser & Optoelectronics Progress
- Vol. 60, Issue 9, 0931001 (2023)
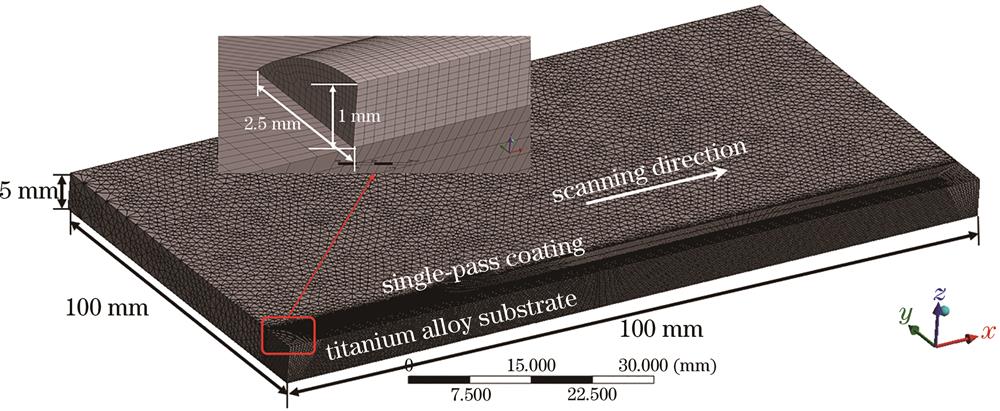
Fig. 1. Finite element model of single-pass coating fusion

Fig. 2. Microscopic images of mixed powders and coating. (a) Mixed powders; (b) composite coating
Fig. 3. Internal heat generation rate curve of a coating unit
Fig. 4. RVE model of Al2O3-Fe coating material
Fig. 5. Parametric curves of material properties. (a) TC4 titanium alloy; (b) composite coating
Fig. 6. Experimental equipment
Fig. 7. Stress distribution cloud map after 3000 s after cladding
Fig. 8. Linear stress analysis path
Fig. 9. Linear stress distribution curve in each direction
Fig. 10. Stress clouds and linear stress comparison at different laser powers. (a) Equivalent stress cloud; (b) linear stress curves
Fig. 11. Comparison of stress clouds and linear stresses at different scanning speeds. (a) Equivalent stress cloud; (b) linear stress curves
Fig. 12. Coating morphology and cracking defects at 300 W and 5 mm/s
Fig. 13. Coating morphology and cracking defects at 600 W and 5 mm/s
Fig. 14. Coating morphology and cracking defects at 900 W and 5 mm/s
Fig. 15. Coating morphology and cracking defects at 600 W and 2 mm/s
Fig. 16. Coating morphology and cracking defects (a large number of fine cracks are present) at 600 W and 8 mm/s
|
Table 1. Experimental parameter design

Set citation alerts for the article
Please enter your email address
© Copyright 2018-2021 | Chinese Laser Press. All Rights Reserved 沪ICP备15018463号-20