
M. Ferraro, F. Mangini, Y. Sun, M. Zitelli, A. Niang, M. C. Crocco, V. Formoso, R. G. Agostino, R. Barberi, A. De Luca, A. Tonello, V. Couderc, S. A. Babin, S. Wabnitz, "Multiphoton ionization of standard optical fibers," Photonics Res. 10, 1394 (2022)
- Photonics Research
- Vol. 10, Issue 6, 1394 (2022)
Abstract
1. INTRODUCTION
The ionization of atoms has been studied for centuries, and it has been experimentally demonstrated in atomic gases. Analogously, ionization can be achieved in solids, and specifically dielectrics. The free electrons which result from ionization generate a plasma, whose ignition produces modifications of the material, i.e., structural damages [1]. Properly engineering these modifications allows for structuring glasses, giving rise to the field of micromachining [2]. Specifically, modifications made on the glass surface can result in the removal of the material, which is referred to as optical ablation [3,4].
Since ionization requires the extraction of electrons from the material, photons must have energies higher than the material bandgap, which in glasses is of the order of a few electron volts. Therefore, at first ultraviolet lasers were used for material ionization [5]. However, the latter can also be obtained when employing lasers with infrared (IR) wavelengths, by exploiting nonlinear effects such as multiphoton absorption (MPA) [6]. Although this requires laser intensities as high as a few
Nevertheless, MPI has also some drawbacks. Notably, when dealing with high-peak-power IR lasers, due to the presence of thermal effects, one may risk not being able to control the features of the induced damages, e.g., their size or rate of formation. In order to overcome this issue, the use of femtosecond laser pulses has been proposed. Ultrafast optics allows, in fact, for avoiding detrimental thermal effects [7]. Although the MPI regime has been widely studied in bulk glasses [8,9], studies of the ionization regime in optical fibers have been limited to the case of photonic bandgap guiding structures [10,11]. In the latter, a plasma is generated thanks to the ionization of a gas that fills the hollow fiber.
Sign up for Photonics Research TOC. Get the latest issue of Photonics Research delivered right to you!Sign up now
As a matter of fact, only few works dealing with standard optical fibers in the MPI regime have been reported in the literature. It is well known that MPI enables the fabrication of fiber Bragg gratings and, when combined with plasma filamentation, may permit the manufacturing of 3D optical memories [12]. Furthermore, it has been recently shown that the cylindrical geometry of optical fibers can be exploited, in order to provide nonstraight shapes to such plasma filaments [13,14]. Nevertheless, to our knowledge, a full characterization of the effects of laser-induced damages on fiber properties and a detailed study of the damage features have not been reported so far.
In this work, we fill this lack by investigating the MPI regime in standard multimode optical fibers (MMFs). The large core area of the latter makes them more suitable than single-mode fibers for exploring extreme nonlinear effects [15,16]. Specifically, we study the effects of MPI-induced damages on the main guiding properties of MMFs. Remarkably, we found that the process of multimode supercontinuum generation (SCG) undergoes a complex evolution on a time scale of several hours. Such an evolution is irreversible, and it comes along with a drop of the net optical transmission from the MMF. Numerical simulations provide useful insight on the physical mechanisms underlying SCG. Since standard optical fibers are mainly used around 1.5 μm for telecom applications, we first investigated SCG in this wavelength range. However, in order to emphasize the role of absorption, which leads to the material damages, we also carried out experiments at 1 μm, the wavelength of operation of Yb-based fiber lasers, whose energy up-scaling and mode-locking remains an open challenge [16,17]. Finally, we analyzed post-mortem samples of MMFs by means of optical microscopy and computed X-ray microtomography (
2. RESULTS
In our experiments, we used graded-index (GRIN) MMFs, whose linear refractive index
Laser pulses were injected into the MMF by a convex lens, so that at the fiber input the beam waist at
A. Experimental Study of Multimode Solitons
When working with high-peak-power femtosecond pulses in the anomalous dispersion regime of GRIN MMFs, e.g., at
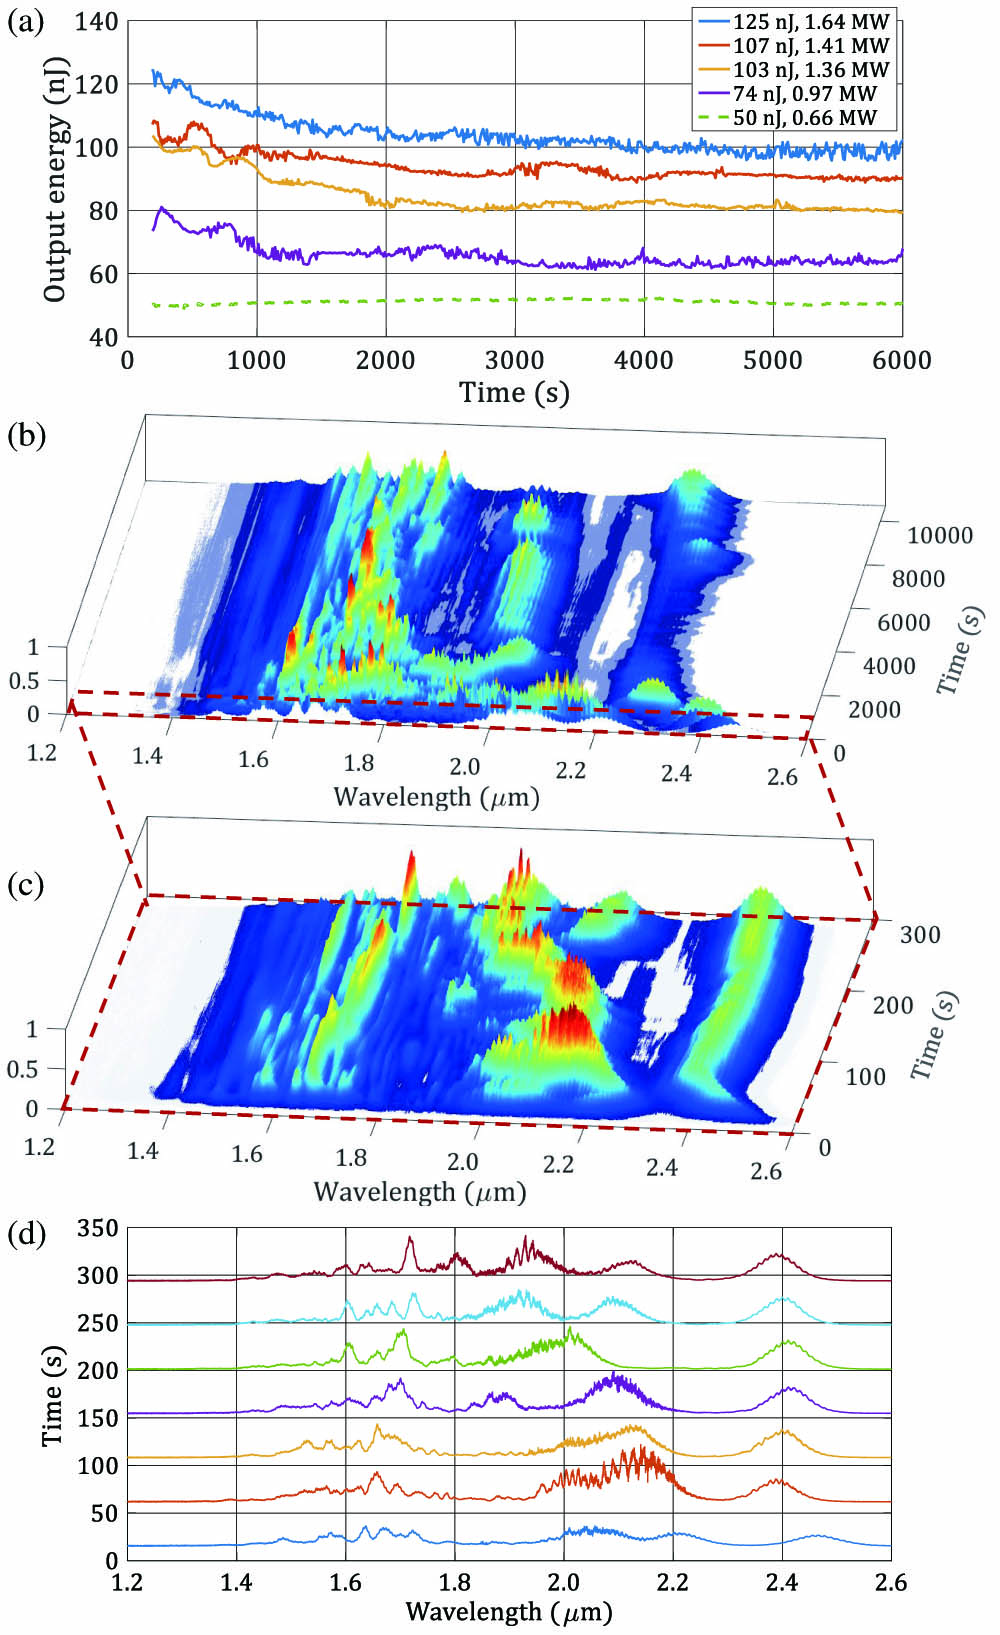
Figure 1.(a) Time evolution of the output beam power from a 30 cm long GRIN fiber span, for different values of the input peak power. The legend shows the values of input pulse energy and peak power, respectively. (b) Slow temporal evolution of the output spectrum, for fixed input pulse peak power
The irreversible reduction of the output power from the fiber is the hallmark of damages generation: these are progressively formed and are responsible for a variation of the local refractive index. As it can be seen in Fig. 1(a), the power transmission curve shows several fluctuations, before reaching a steady value after about 2 h. As a matter of fact, SCG from the GRIN fiber exhibits an irreversible evolution, which is characterized by two different time scales [cfr. Figs. 1(b) and 1(c)]. These cannot be distinguished by the thermal power meter, because of its slow response. However, one can easily monitor variations of the SC spectra at the fiber output. For the sake of simplicity, we only report in Figs. 1(b) and 1(c) the temporal dependence of the output spectrum, which corresponds to the red curve in Fig. 1(a). As one can see in Fig. 1(c), SCG exhibits a slow and continuous reshaping: two distinct spectral lobes, corresponding to different Raman solitons that are initially generated around 2.0 μm and 2.2 μm, respectively, merge into a single lobe after 50 s, only to split again after about 200 s. Eventually, Figs. 1(a) and 1(b) show that, over a time scale of hours, the output power remains stable; correspondingly, an equilibrium spectral distribution is reached, with
B. Numerical Study of Multimode Solitons
The occurrence of a power transmission drop and its associated stable output spectral distribution are due to a quenching of the output beam energy, owing to an increase of either fiber absorption or light scattering by the generated damages [26,27]. Indeed, our experimental observations can be qualitatively reproduced by numerical simulations based on the generalized multimode nonlinear Schrödinger equation. Specifically, our simulations are based on the model described in Ref. [28]. Here, we took into account chromatic dispersion up to the fourth order, as well as self-steepening, Kerr, and Raman nonlinearities. For a standard GRIN MMF whose core diameter is 50 μm, we considered a dispersion length of 0.16 m at
With respect to Ref. [28], we also included the presence of wavelength-dependent linear losses: the fiber loss coefficient increases by 4 orders of magnitude when
As it turns out, this numerical model permits for qualitatively retrieving the experimentally observed changes of the output spectra. As it can be seen, simulations reported in Fig. 2(b) show that multiple spectral lobes, associated with the different Raman solitons that are generated at the fiber output, separate, merge, and then separate again, as the input pulse energy grows smaller. This is similar to the observations of Fig. 1(b), when we consider that fiber losses progressively grow larger in time. A detailed study of the process of soliton spectral merging, whose discussion is beyond the scope of the present work, reveals that it can be explained by considering the multimode nature of Raman soliton generation in a GRIN fiber [30]. Here, we provide a way for appreciating the qualitative agreement between experiments and simulations. In particular, we associate the input pulse energy with the long time scale of evolution of the power at the fiber output [see Fig. 2(c)]. This is done by fitting by an exponential curve the experimental data in Fig. 1(a) at
![]()
Figure 2.(a) Wavelength dependence of the linear loss profile in simulations. (b) Numerical simulation of output spectrum changes versus input pulse energy. All parameters are the same as in experiments of Fig.
C. Comparison between Normal and Anomalous Dispersion Regimes
Although we have shown that MPI-associated defects have a dramatic effect on SCG pumped at 1.55 μm, at this wavelength linear loss has a minimum [see Fig. 2(a)]; hence MPI is relatively weak. Therefore, in order to maximize the generation of laser-induced damages, we moved the pump pulse wavelength to 1.03 μm, so that its propagation occurs in the normal dispersion regime. Remarkably, although changing the dispersion regime at the pump wavelength has profound effects on SCG, the fiber transmission drop at 1.03 μm turns out to be similar to (and much more rapid than) at 1.55 μm [cfr. Fig. 3(a)]. This indicates that most of the pump power is lost at the beginning of the fiber, i.e., over the first few millimeters. As a matter of fact, by optical microscopy we could confirm that at longer fiber lengths no damages were generated. Furthermore, we verified that by cleaving the fiber input face by about 5 mm, we could fully recover the original level of fiber transmission.
![]()
Figure 3.Comparison between MPI regime established at 1.03 μm and 1.55 μm of wavelength: (a) transmission; (b), (c) luminescence; (d), (e) damages imaged by optical microscopy. The white bars in (b)–(e) correspond to 100 μm. The input energy and the peak power are
Note that the millimeter scale is much shorter than the nonlinear length associated with other nonlinear effects besides MPI, such as SSFS and SCG. The occurrence of multiphoton effects can be appreciated by looking at Figs. 3(b) and 3(c), where we compare the MPA-induced luminescence of the fiber input tip, when using input femtosecond pulses at either 1.03 μm or 1.55 μm pump wavelengths, respectively. As it can be seen, the luminescence traces look rather similar, and no effects of VIS light emission that is associated with SCG can be detected. Only slight differences in the luminescence color are appreciable: these can be ascribed to the different nature of the laser-induced defects [31]. Luminescence appears at equally spaced discrete points, owing to spatial self-imaging, a typical property of GRIN fibers [32]: because of the refractive index grading, the propagating beam periodically reproduces its spatial profile. As a side note, it is worth mentioning that luminescence is a priceless tool for micromachining, since it allows for a significant improvement of the laser beam alignment. This has found applications to the inscription of fiber Bragg gratings [33], to determining the optical fiber cutoff frequency [34], as well as to tracking the propagation path of skew-rays [13].
The difference between defect generation by laser pulses propagating in opposite chromatic dispersion regimes can be better appreciated by imaging post-mortem samples. In Figs. 3(d) and 3(e), we show images captured by an optical microscope (Zeiss Axiolab 5) in a quasi-cross-polarization configuration. As it can be seen, although exactly the same input conditions (peak power and beam waist) were used, the fiber is notably more damaged when the input wavelength is 1.03 μm [Fig. 3(d)], whereas the fiber appears to be barely affected by pump pulses at 1.55 μm [Fig. 3(e)]. The microscope image in Fig. 3(d) allows for clearly appreciating the shape of the damages, which is remarkably similar to that of MPI-ignited plasma at the self-focusing point in bulk glasses [35,36]. It is worth pointing out that, at variance from the latter, where damages are only induced at the self-focusing point, when the guiding properties of MMFs are exploited (specifically, the spatial self-imaging effect), one is able to simultaneously modify the refractive index of the fiber core along an array of several (equally spaced) points.
D. X-Ray Microtomography
Optical microscopy techniques, such as shearing, phase-contrast, Fourier, as well as Raman spectroscopy are widely used to detect the presence of damages in glasses [37,38]. However, although quantitative information can be extracted about the absolute value of the refractive index local variation, the sign of this variation remains unknown. As a matter of fact, power collected by the microscope scales quadratically with the laser-induced refractive index change [39].
In this context, we propose to exploit the material properties at X-ray frequencies. Here,
In Fig. 4(a), we report a radiographic image of the tip of the fiber before any damaging has occurred. This image was obtained by averaging over 100 acquisitions, corresponding to a total exposure time of 1000 s. We used a microfocus source (Hamamatsu L12161-07), which emits a conical polychromatic, 10 W average power X-ray beam. The maximum energy of the X-photons was of 60 keV. The intensity profile across the transverse dimension of the fiber, measured by a flat panel detector (Hamamatsu C7942SK-05) after averaging over a longitudinal path
![]()
Figure 4.X-ray imaging. (a) Radiography of a brand-new GRIN 50/125 fiber. (b) Corresponding intensity profile along the transverse direction
Nevertheless, results in Figs. 4(a) and 4(b) clearly demonstrate that the presence of index grading in the fiber core is captured by X-ray absorption measurements. This indicates that
Some interesting features, indicating the presence of damages, could indeed be detected. In particular, in Fig. 4(c) we may appreciate that, different from the other two zones, the red zone experiences a local shrinkage. The relationship between the latter and the damages imaged by optical microscopy can be revealed by examining Fig. 5. Here, we show first the microscope image of the damaged fiber [Fig. 5(a)]. Next, in Fig. 5(b), we compare the intensity profile of Fig. 5(a) along the fiber axis (black curve), with the diameter of the
![]()
Figure 5.Analysis of fiber damages. (a) Optical microscope image. (b) Comparison between the intensity profile along the fiber axis in (a) (black curve) with the diameter of the red zone (red area). (c) Variation along
In our measurements, we have approached the magnification limit of our
3. CONCLUSION
In conclusion, we studied the damages to standard optical fibers which are induced by MPI of intense femtosecond laser pulses, that propagate either in the normal or in the anomalous dispersion regime. Remarkably, by monitoring the output spectrum and the power transmission of the fiber, we observed that MPI damaging has strong macroscopic effects, specifically, a slow temporal reshaping of SCG. Both the transmitted power and the SC spectra experience an irreversible temporal evolution toward equilibrium values. These are reached within a time scale of the order of a few hours, during which local modifications of the refractive index are progressively generated. The latter could be detected by means of optical microscopy and
Acknowledgment
Acknowledgment. We acknowledge the support of CILAS Company (ArianeGroup, X-LAS laboratory) and “Région Nouvelle Aquitaine” (F2MH and Nematum).
References
[1] K. M. Davis, K. Miura, N. Sugimoto, K. Hirao. Writing waveguides in glass with a femtosecond laser. Opt. Lett., 21, 1729-1731(1996).
[2] Y. Hanada, K. Sugioka, Y. Gomi, H. Yamaoka, O. Otsuki, I. Miyamoto, K. Midorikawa. Development of practical system for laser-induced plasma-assisted ablation (LIPAA) for micromachining of glass materials. Appl. Phys. A, 79, 1001-1003(2004).
[3] B. C. Stuart, M. D. Feit, S. Herman, A. M. Rubenchik, B. W. Shore, M. D. Perry. Optical ablation by high-power short-pulse lasers. J. Opt. Soc. Am. B, 13, 459-468(1996).
[4] B. Chimier, O. Utéza, N. Sanner, M. Sentis, T. Itina, P. Lassonde, F. Légaré, F. Vidal, J. Kieffer. Damage and ablation thresholds of fused-silica in femtosecond regime. Phys. Rev. B, 84, 094104(2011).
[5] P. Karlitschek, G. Hillrichs, K.-F. Klein. Photodegradation and nonlinear effects in optical fibers induced by pulsed UV-laser radiation. Opt. Commun., 116, 219-230(1995).
[6] M. Lenzner, J. Krüger, S. Sartania, Z. Cheng, C. Spielmann, G. Mourou, W. Kautek, F. Krausz. Femtosecond optical breakdown in dielectrics. Phys. Rev. Lett., 80, 4076-4079(1998).
[7] M. Perry, B. Stuart, P. Banks, M. Feit, V. Yanovsky, A. Rubenchik. Ultrashort-pulse laser machining of dielectric materials. J. Appl. Phys., 85, 6803-6810(1999).
[8] D. Von der Linde, H. Schüler. Breakdown threshold and plasma formation in femtosecond laser–solid interaction. J. Opt. Soc. Am. B, 13, 216-222(1996).
[9] M. Li, S. Menon, J. P. Nibarger, G. N. Gibson. Ultrafast electron dynamics in femtosecond optical breakdown of dielectrics. Phys. Rev. Lett., 82, 2394-2397(1999).
[10] P. Hölzer, W. Chang, J. Travers, A. Nazarkin, J. Nold, N. Joly, M. F. Saleh, F. Biancalana, P. St.J. Russell. Femtosecond nonlinear fiber optics in the ionization regime. Phys. Rev. Lett., 107, 203901(2011).
[11] M. F. Saleh, W. Chang, P. Hölzer, A. Nazarkin, J. C. Travers, N. Y. Joly, P. St.J. Russell, F. Biancalana. Theory of photoionization-induced blueshift of ultrashort solitons in gas-filled hollow-core photonic crystal fibers. Phys. Rev. Lett., 107, 203902(2011).
[12] S.-H. Cho, H. Kumagai, I. Yokota, K. Midorikawa, M. Obara. Observation of self-channeled plasma formation and bulk modification in optical fibers using high-intensity femtosecond laser. Jpn. J. Appl. Phys., 37, L737(1998).
[13] F. Mangini, M. Ferraro, M. Zitelli, V. Kalashnikov, A. Niang, T. Mansuryan, F. Frezza, A. Tonello, V. Couderc, A. Aceves, S. Wabnitz. Rainbow Archimedean spiral emission from optical fibres. Sci. Rep., 11, 13030(2021).
[14] F. Mangini, M. Ferraro, M. Zitelli, A. Niang, T. Mansuryan, A. Tonello, V. Couderc, A. De Luca, S. Babin, F. Frezza, S. Wbnitz. Helical plasma filaments from the self-channeling of intense femtosecond laser pulses. Opt. Lett., 47, 1-4(2022).
[15] A. Picozzi, G. Millot, S. Wabnitz. Nonlinear virtues of multimode fibre. Nat. Photonics, 9, 289-291(2015).
[16] K. Krupa, A. Tonello, A. Barthélémy, T. Mansuryan, V. Couderc, G. Millot, P. Grelu, D. Modotto, S. A. Babin, S. Wabnitz. Multimode nonlinear fiber optics, a spatiotemporal avenue. APL Photonics, 4, 110901(2019).
[17] L. G. Wright, D. N. Christodoulides, F. W. Wise. Spatiotemporal mode-locking in multimode fiber lasers. Science, 358, 94-97(2017).
[18] S. Sandoghchi, G. Jasion, N. Wheeler, S. Jain, Z. Lian, J. Wooler, R. Boardman, N. Baddela, Y. Chen, J. Hayes, E. Numkam Fokoua, T. Bradley, D. R. Gray, S. M. Mousavi, M. Petrovich, F. Poletti, D. J. Richardson. X-ray tomography for structural analysis of microstructured and multimaterial optical fibers and preforms. Opt. Express, 22, 26181-26192(2014).
[19] Z. H. Levine, A. P. Peskin, E. J. Garboczi, A. D. Holmgren. Multi-energy X-ray tomography of an optical fiber: the role of spatial averaging. Microsc. Microanal., 25, 70-76(2019).
[20] Z. H. Levine, E. J. Garboczi, A. P. Peskin, A. A. Ekman, E. Mansfield, J. D. Holm. X-ray computed tomography using partially coherent Fresnel diffraction with application to an optical fiber. Opt. Express, 29, 1788-1804(2021).
[21] M. Ferraro, F. Mangini, M. Zitelli, A. Tonello, A. D. Luca, V. Couderc, S. Wabnitz. Femtosecond nonlinear losses in multimode optical fibers. Photon. Res., 9, 2443-2453(2021).
[22] M. Zitelli, F. Mangini, M. Ferraro, A. Niang, D. Kharenko, S. Wabnitz. High-energy soliton fission dynamics in multimode GRIN fiber. Opt. Express, 28, 20473-20488(2020).
[23] J. Santhanam, G. P. Agrawal. Raman-induced spectral shifts in optical fibers: general theory based on the moment method. Opt. Commun., 222, 413-420(2003).
[24] A. S. Ahsan, G. P. Agrawal. Graded-index solitons in multimode fibers. Opt. Lett., 43, 3345-3348(2018).
[25] T. Hansson, A. Tonello, T. Mansuryan, F. Mangini, M. Zitelli, M. Ferraro, A. Niang, R. Crescenzi, S. Wabnitz, V. Couderc. Nonlinear beam self-imaging and self-focusing dynamics in a GRIN multimode optical fiber: theory and experiments. Opt. Express, 28, 24005-24021(2020).
[26] A. Reupert, M. Heck, S. Nolte, L. Wondraczek. Side-emission properties of femtosecond laser induced scattering centers in optical fibers. Opt. Mater. Express, 9, 2497-2510(2019).
[27] E. G. Rawson. Measurement of the angular distribution of light scattered from a glass fiber optical waveguide. Appl. Opt., 11, 2477-2481(1972).
[28] L. G. Wright, Z. M. Ziegler, P. M. Lushnikov, Z. Zhu, M. A. Eftekhar, D. N. Christodoulides, F. W. Wise. Multimode nonlinear fiber optics: massively parallel numerical solver, tutorial, and outlook. IEEE J. Sel. Top. Quantum Electron., 24, 5100516(2017).
[29] K. A. Hamam, Y. E.-D. Gamal. Numerical analysis of breakdown dynamics dependence on pulse width in laser-induced damage in fused silica: role of optical system. Results Phys., 9, 725-733(2018).
[30] Y. Sun, M. Zitelli, M. Ferraro, F. Mangini, P. Parra-Rivas, S. Wabnitz. Multimode soliton collisions in graded-index optical fibers(2022).
[31] F. Mangini, M. Ferraro, M. Zitelli, A. Niang, A. Tonello, V. Couderc, S. Wabnitz. Multiphoton-absorption-excited up-conversion luminescence in optical fibers. Phys. Rev. Appl., 14, 054063(2020).
[32] M. Karlsson, D. Anderson, M. Desaix. Dynamics of self-focusing and self-phase modulation in a parabolic index optical fiber. Opt. Lett., 17, 22-24(1992).
[33] C. Hnatovsky, D. Grobnic, S. J. Mihailov. Nonlinear photoluminescence imaging applied to femtosecond laser manufacturing of fiber Bragg gratings. Opt. Express, 25, 14247-14259(2017).
[34] F. Mangini, M. Ferraro, M. Zitelli, A. Niang, A. Tonello, V. Couderc, O. Sidelnikov, F. Frezza, S. Wabnitz. Experimental observation of self-imaging in SMF-28 optical fibers. Opt. Express, 29, 12625-12633(2021).
[35] H. Schmitz, V. Mezentsev. Full-vectorial modeling of femtosecond pulses for laser inscription of photonic structures. J. Opt. Soc. Am. B, 29, 1208-1217(2012).
[36] L. Sudrie, A. Couairon, M. Franco, B. Lamouroux, B. Prade, S. Tzortzakis, A. Mysyrowicz. Femtosecond laser-induced damage and filamentary propagation in fused silica. Phys. Rev. Lett., 89, 186601(2002).
[37] J. W. Chan, T. Huser, S. Risbud, D. Krol. Structural changes in fused silica after exposure to focused femtosecond laser pulses. Opt. Lett., 26, 1726-1728(2001).
[38] R. Osellame, G. Cerullo, R. Ramponi. Femtosecond Laser Micromachining: Photonic and Microfluidic Devices in Transparent Materials, 123(2012).
[39] A. Reupert, M. Heck, S. Nolte, L. Wondraczek. Angular scattering pattern of femtosecond laser-induced refractive index modifications in optical fibers. Adv. Opt. Mater., 8, 2000633(2020).
[40] R. Conte, R. Filosa, V. Formoso, F. Gagliardi, R. G. Agostino, G. Ambrogio. Analysis of extruded pins manufactured by friction stir forming for multi-material joining purposes. AIP Conf. Proc., 2113, 050026(2019).
[41] V. Cnudde, M. N. Boone. High-resolution X-ray computed tomography in geosciences: a review of the current technology and applications. Earth Sci. Rev., 123, 1-17(2013).
[42] I. Taina, R. Heck, T. Elliot. Application of X-ray computed tomography to soil science: a literature review. Can. J. Soil Sci., 88, 1-19(2008).
[43] S. Stabile, F. Palermo, I. Bukreeva, D. Mele, V. Formoso, R. Bartolino, A. Cedola. A computational platform for the virtual unfolding of Herculaneum Papyri. Sci. Rep., 11, 1695(2021).
[44] M. López-Prat, R. G. Agostino, S. R. Bandyopadhyay, B. Carrascosa, M. C. Crocco, R. De Luca, R. Filosa, V. Formoso, C. Lancelotti, N. A. Noori, A. Pecci, J. Simón-Cortés, D. Miriello. Architectural terracruda sculptures of the silk roads: new conservation insights through a diagnostic approach based on non-destructive X-ray micro-computed tomography. Stud. Conserv., 67, 209-221(2021).
[45] J. Schindelin, I. Arganda-Carreras, E. Frise, V. Kaynig, M. Longair, T. Pietzsch, S. Preibisch, C. Rueden, S. Saalfeld, B. Schmid, J.-Y. Tinevez, D. J. White, V. Hartenstein, K. Eliceiri, P. Tomancak, A. Cardona. Fiji: an open-source platform for biological-image analysis. Nat. Methods, 9, 676-682(2012).


Set citation alerts for the article
Please enter your email address

© Copyright 2018-2021 | Chinese Laser Press. All Rights Reserved 沪ICP备15018463号-20