
Xue LI, Li WANG, Guang-xian LIU, Zong-cai TU. Effect of Urea on Glycosylation of BSA Based on Spectral Techniques[J]. Spectroscopy and Spectral Analysis, 2021, 41(2): 478
- Spectroscopy and Spectral Analysis
- Vol. 41, Issue 2, 478 (2021)
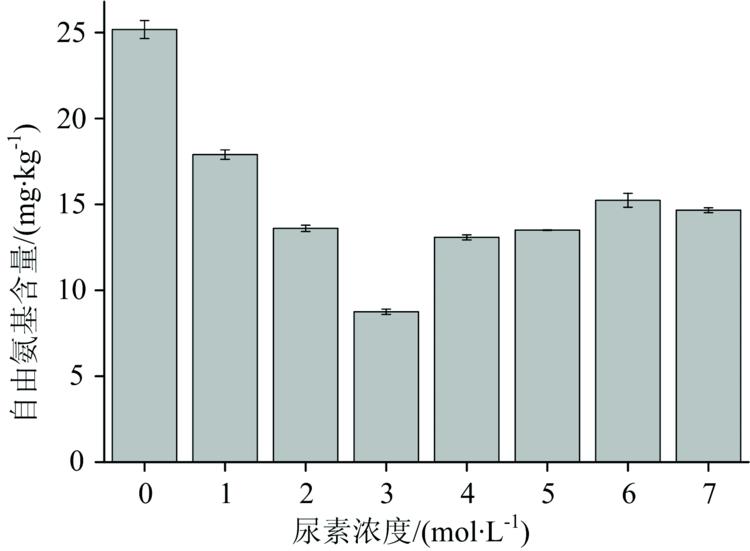
Fig. 1. The free amino group content of glycosylation of BSA treated with different concentrations of urea
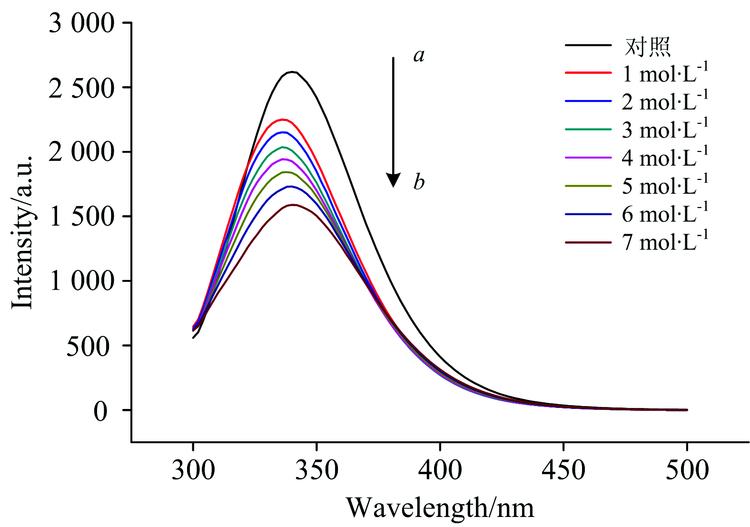
Fig. 2. Fluorescence spectra of glycosylation of BSA treated with different concentrations of urea
a →b : 0, 1, 2, 3, 4, 5, 6, 7 mol·L-1
Fig. 3. The space structure of BSA
Fig. 4. Synchronous fluorescence spectra after glycosylation of BSA in different urea treatments
(a): Δλ =15 nm, (a →b ): 1, 2, 3, 0, 4, 5, 6, 7 mol·L-1; (b): Δλ =60 nm, (a →b ): 0, 1, 2, 3, 4, 5, 6, 7 mol·L-1
(a): Δ
Fig. 5. Ultraviolet scanning spectra after glycosylation of BSA in different urea treatments
a →b : 3, 4, 5, 7, 6, 2, 1, 0 mol·L-1
Fig. 6. 3D fluorescence spectra after glycosylation of BSA and BSA in different urea treatments
|
Table 1. Typical three-dimensional fluorescence peaks

Set citation alerts for the article
Please enter your email address
© Copyright 2018-2021 | Chinese Laser Press. All Rights Reserved 沪ICP备15018463号-20