
Cuiping Ma, Peng Yu, Zhimin Jing, Yisong Zhu, Peihang Li, Wenhao Wang, Hongxing Xu, Yanning Zhang, Liang Pan, Tae-Youl Choi, Arup Neogi, Alexander O. Govorov, Zhiming Wang, "Circular polarization-selective optical, photothermal, and optofluidic effects in chiral metasurfaces," Photonics Res. 12, 331 (2024)
- Photonics Research
- Vol. 12, Issue 2, 331 (2024)
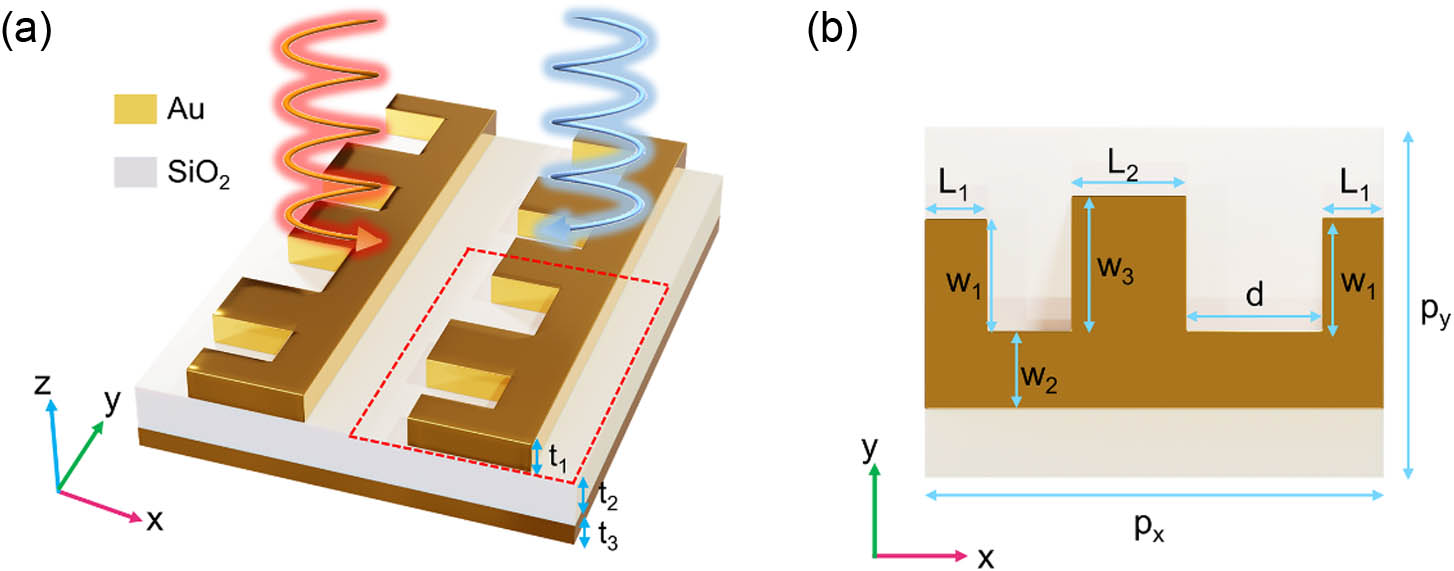
Fig. 1. Structure design of the metasurface. (a) Sketch of the chiral metasurface consisting of Au nanoantenna arrays and a bottom Au film separated by a SiO 2 t 1 = 55 nm t 3 = 100 nm SiO 2 t 2 = 150 nm p x = 600 nm p y = 470 nm L 1 = 75 nm L 2 = 100 nm w 1 = 180 nm w 2 = 100 nm w 3 = 200 nm d = 210 nm
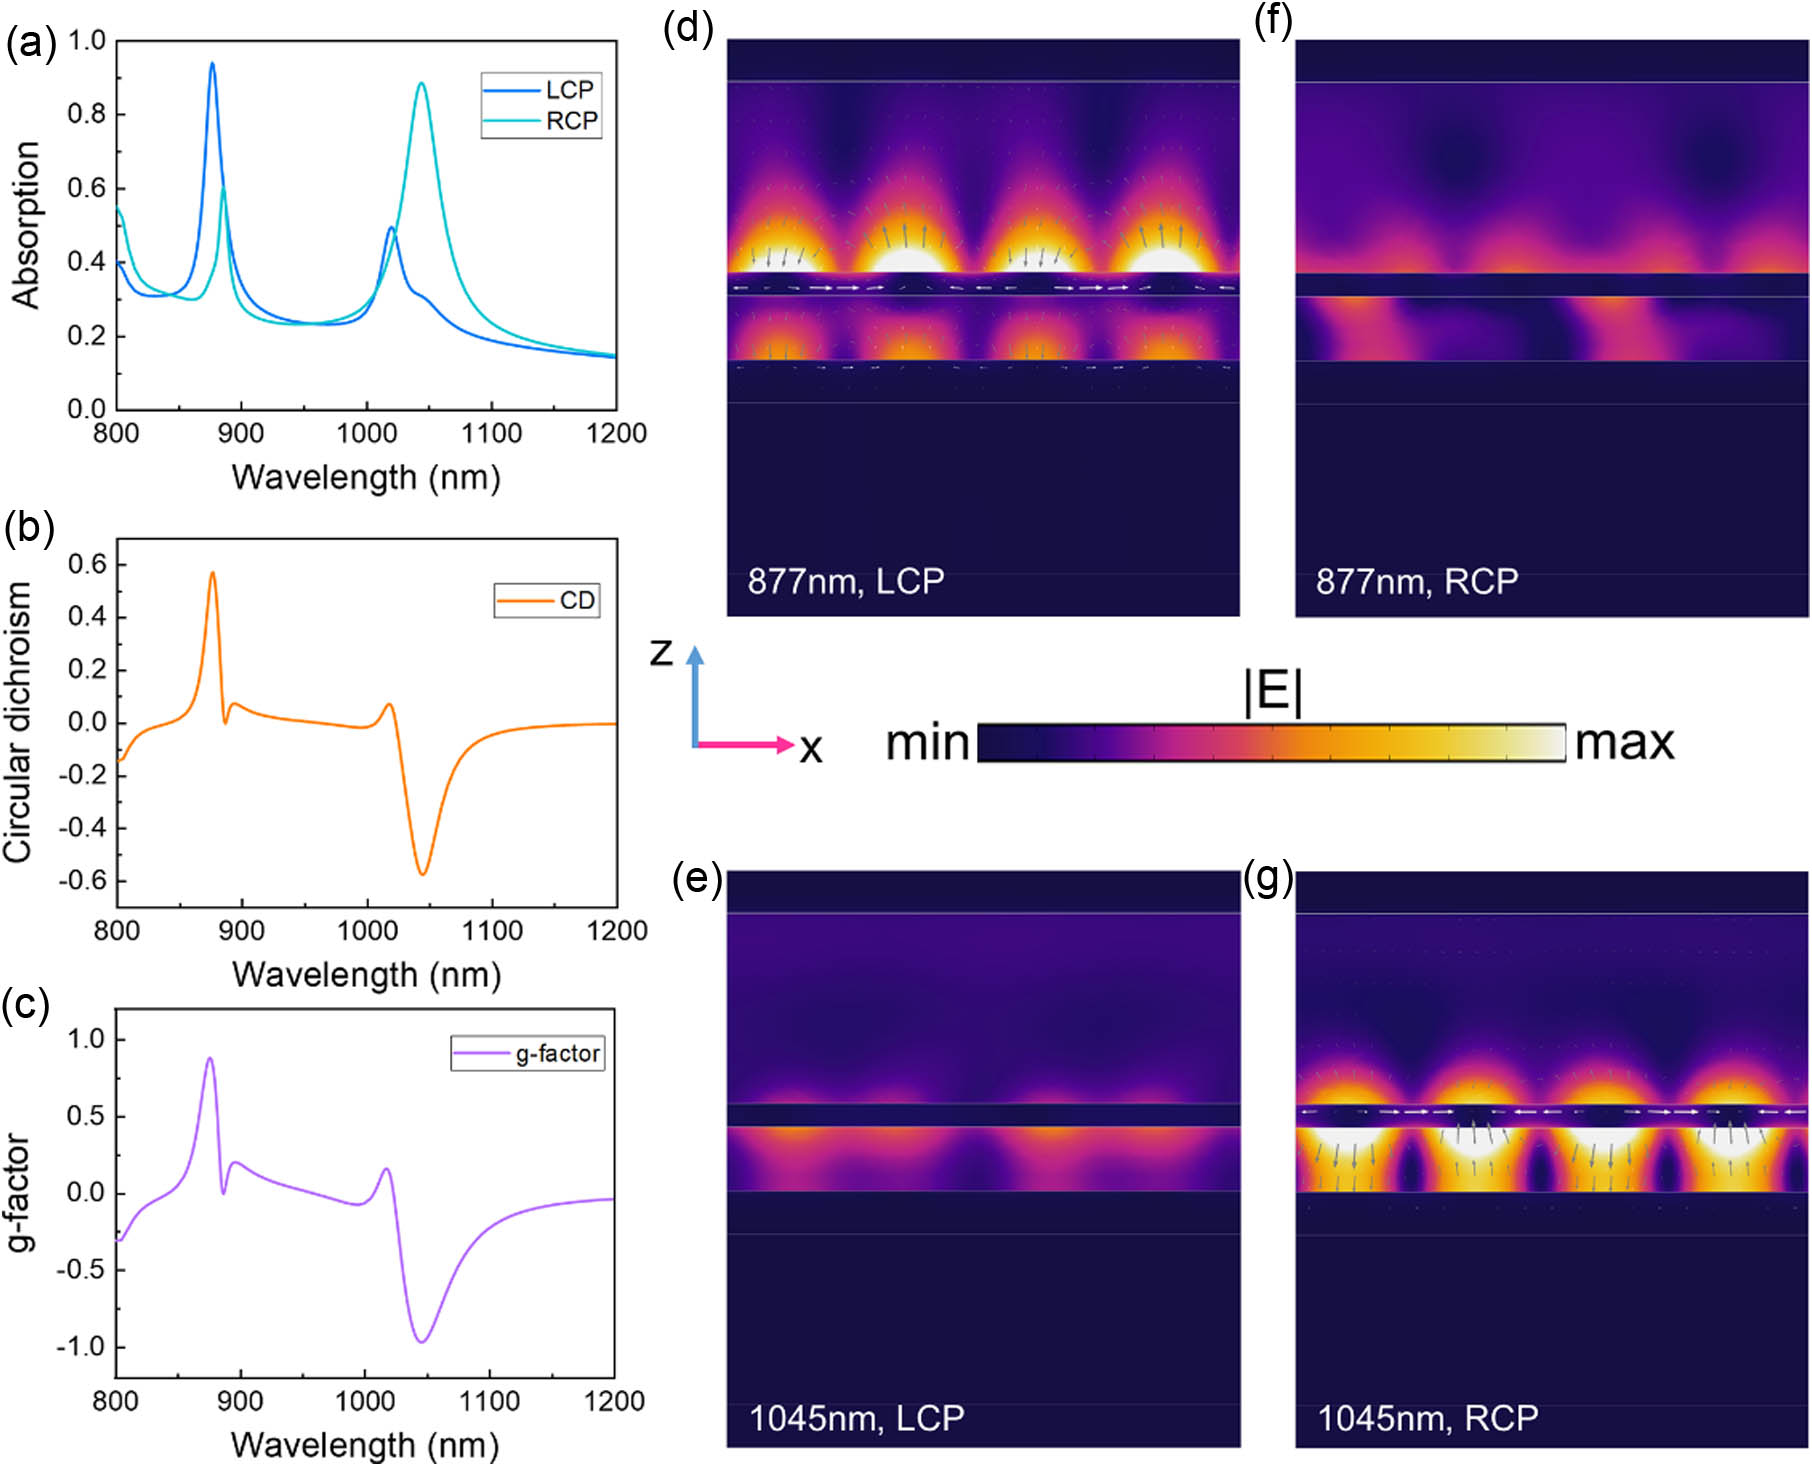
Fig. 2. Electromagnetic response of the chiral metasurface. (a) Simulated optical response under LCP (blue) and RCP (cyan) illumination. (b) CD and (c) g factor spectrum of the chiral metasurface. (d)–(g) Spatial electric intensity profiles are taken from the x z y = − 350 nm
Fig. 3. Photothermal effect of the chiral metasurface. Average temperature increases of the whole system as a function of time under LCP (orange) and RCP (cyan) illumination at the resonant wavelength of (a) 877 nm and (b) 1045 nm. (c) Photothermal circular dichroism as a function of time at 877 nm (magenta) and 1045 nm (blue). (d)–(f) Photo-induced temperature increase in the x z y = 0 nm t = 2000 ns
Fig. 4. Thermally-induced fluid motion of the water. (a) Velocity spectra with LCP (pink) and RCP (gray) illumination. (b) Calculated velocity CD (blue) and g v x z y = 0 nm t = 2000 ns
Fig. 5. Chiral fluid convection in y z y z x = 120 nm
Fig. 6. g g g g
Fig. 7. (a) Simulated optical response of CB enantiomer under LCP (blue) and RCP (cyan) illumination. (b) CD spectrum of CB system. (c) g
Fig. 8. Three-dimensional cross-section diagram of the electromagnetic response at the two wavelengths (a), (b) 877 nm and (c)–(e) 1045 nm under (a), (b) LCP and (c)–(e) RCP incidence. Simulated electric intensity profiles are taken from the x y z = − 100 nm z = 100 nm y z x = 0 nm
Fig. 9. Photo-induced temperature increase at the two wavelengths (a), (b) 877 nm and (c), (d) 1045 nm in the vertical cross-sections at y = 0 nm I 0 = 10 5 W / cm 2 t = 2000 ns
Fig. 10. Velocity patterns (streamlines) overlaying the temperature gradient of the resonator in x z y = 100 nm


Set citation alerts for the article
Please enter your email address

© Copyright 2018-2021 | Chinese Laser Press. All Rights Reserved 沪ICP备15018463号-20