【AIGC One Sentence Reading】:This study reveals a chiral metasurface exhibiting dual-band circular polarization selectivity, impacting not only optical response but also photothermal effects and fluid dynamics, opening new avenues for chiral light-matter interactions.
【AIGC Short Abstract】:This study introduces a chiral metasurface exhibiting circular polarization selectivity in dual bands, impacting both optical and photothermal responses, as well as fluid dynamics. By optimizing the metasurface design, strong chiral signals are achieved, advancing our understanding of circular dichroism and opening new possibilities for chiral interactions in nanophotonics and optofluidics.
Note: This section is automatically generated by AI . The website and platform operators shall not be liable for any commercial or legal consequences arising from your use of AI generated content on this website. Please be aware of this.
Abstract
Circular dichroism (CD) is extensively used in various material systems for applications including biological detection, enantioselective catalysis, and chiral separation. This paper introduces a chiral absorptive metasurface that exhibits a circular polarization-selective effect in dual bands—positive and negative CD peaks at short wavelengths and long wavelengths, respectively. Significantly, we uncover that this phenomenon extends beyond the far-field optical response, as it is also observed in the photothermal effect and the dynamics of thermally induced fluid motion. By carefully engineering the metasurface design, we achieve two distinct CD signals with high factors () at the wavelengths of 877 nm and 1045 nm, respectively. The findings presented in this study advance our comprehension of CD and offer promising prospects for enhancing chiral light–matter interactions in the domains of nanophotonics and optofluidics.
1. INTRODUCTION
The chiral effect has garnered increasing research interest due to its broad applications in optical devices [1–4], such as circular polarizers [5–7], sensing [8–11], and analytical chemistry [12]. Chirality refers to an object that cannot coincide with its mirror image through arbitrary translation and rotation operations [13,14]. While chirality is an intrinsic property of many life-related substances including DNA, amino acids, and some viruses, the chiral response of natural materials is typically weak [15]. Fortunately, artificially designed plasmonic metamaterials can achieve stronger chirality due to their extraordinary capabilities in enhancing light–matter interactions [16–21]. This enhanced chirality results in a stronger circular dichroism (CD) signal, arising from the differential absorption between left circularly polarized (LCP) and right circularly polarized (RCP) waves of a plasmonic chiral structure [22,23]. CD spectroscopy plays a critical and significant role in discriminating the unique properties of chiral substances, with applications in chemistry, physics, and life sciences. Some studies have reported plasmonic chiral nanostructures exhibit tunable CD signals at two wavelengths [24–27] or are only effective for detecting circularly polarized light (CPL) at a single wavelength [28–30]. However, there are few reports on the study of one positive CD signal and one negative CD signal appearing at different wavelengths in terms of the photothermal effects and optofluidic properties.
This paper presents the theoretical design of a straightforward 2D planar metal–insulator–metal (MIM) metasurface, which exhibits two CD peaks with a positive value at a short wavelength and a negative value at a long wavelength. Its optical CD values reach and at 877 nm and 1045 nm, respectively. Furthermore, we explore the chiral photothermal and optofluidic effects of the proposed chiral metasurface. Recently, photothermal circular dichroism () and optofluidic circular dichroism () have been proposed successively [31,32]. The photothermal CD has potential applications in polarization-sensitive surface photochemistry and chiral bolometers [31,33]. In addition, optofluidic CD can potentially be used in lab-on-a-chip devices for analyzing and sorting particles and cells [32]. Thus, studying the CD effect in optofluidics is crucial for advancing chiral plasmonics. We believe, to the best of our knowledge, that the and effect in our design provides a new idea for the future study of chiral plasmonics and renders itself to be of great potential in applications such as tunable circular polarizers, polarization-sensitive surface photochemistry, chiral bolometers, polarization-sensitive optofluidics, and bioanalysis [34].
2. RESULTS AND DISCUSSION
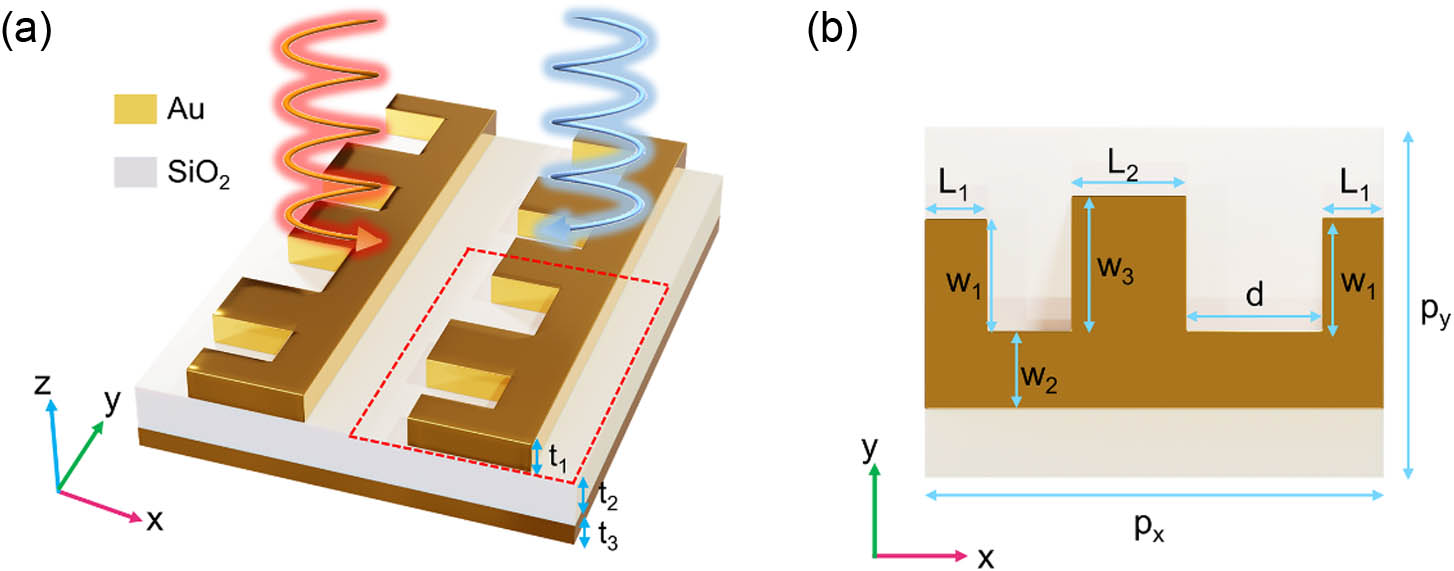
Figure 1(a) presents the schematic of the metasurface, which employs a typical metal–insulator–metal (MIM) structure using gold as the metal and silica as the insulator. The red dashed box emphasizes the size of the unit cell and the whole surface is covered with water. In Fig. 1(b), the resonator’s unit cell adopts an “E” shape that has been counterclockwise rotated by 90°. The Au backplane is 100 nm thick and is optically thick, effectively preventing light transmission. Due to the complete absence of transmission (), the absorption can be calculated as , where represents the reflectivity of light.
Sign up for Photonics Research TOC. Get the latest issue of Photonics Research delivered right to you!Sign up now
Figure 1.Structure design of the metasurface. (a) Sketch of the chiral metasurface consisting of Au nanoantenna arrays and a bottom Au film separated by a layer. The substrate is silicon and the top medium is water. The thicknesses of the top Au resonators and bottom Au layer are and , respectively; the thickness of the spacer is . The red dashed box indicates the size of the unit cell. (b) Top view of the unit cell with a period of and . The optimized geometric parameters are set as , , , , , and .
Figure 2(a) depicts the optical absorption of the metasurface. The structure under investigation is termed CA, and its enantiomer is referred to as CB. For example, the CA system demonstrates strong absorption of LCP light at shorter wavelengths and heightened absorption of RCP light at longer wavelengths, indicating a pronounced CD effect. The initial CD peak occurs at 877 nm, where the absorption rates for LCP and RCP light are approximately 0.94 and 0.37, respectively. The absorptive CD can be characterized as
Figure 2.Electromagnetic response of the chiral metasurface. (a) Simulated optical response under LCP (blue) and RCP (cyan) illumination. (b) CD and (c) g factor spectrum of the chiral metasurface. (d)–(g) Spatial electric intensity profiles are taken from the section at . The images are recorded at (d), (f) 877 nm and (e), (g) 1045 nm under (d), (e) LCP and (f), (g) RCP incidence.
Therefore, the dominance of LCP absorption results in a positive CD of , which appears as a peak at 877 nm, as shown in Fig. 2(b). On the contrary, stronger absorption of RCP light is evident at the wavelength of 1045 nm, where the absorptions of LCP and RCP light are about 0.88 and 0.30, respectively. According to Eq. (1), the CD is approximately . Thus, the spectral line exhibits a valley at 1045 nm. The maximum and minimum CD values stem from selective absorption of circularly polarized light (CPL). A phase mutation can be observed when calculating the phase change at the two specific wavelengths [32].
Similarly, the optical absorption results for the CB system are outlined in Fig. 7 (Appendix A). In this case, stronger absorption of RCP and LCP light is observed at shorter and longer wavelengths, respectively. Within the CB system, a negative CD of and a positive CD of at 877 nm and 1045 nm, respectively, are documented in Fig. 7. Concurrently, the factor of the enantiomers is explored, as illustrated in Fig. 2(c) and Fig. 7. The factor, a widely recognized measure to characterize chirality, is formulated as
A similar lineshape also appears in factor spectra, which further presents the asymmetry of the system.
To gain a deeper understanding of the physical mechanism driving the CD effects at the two wavelengths, we examine the electric field distributions of the chiral metasurface, as depicted in Figs. 2(d)–2(g). For this analysis, slices from the plane at are used, employing a array to enhance the investigation of the electromagnetic response. The electric-field enhancement and distribution in the CA system vary under LCP and RCP illumination, which is attributable to the destructive and constructive interference of the illumination. At 877 nm, LCP absorption is prominent, as evident in Figs. 2(d) and 2(f). Under LCP illumination, the electric field is primarily concentrated on the air side of the chiral E-shaped structure and extends into the air domain, as illustrated in Fig. 2(d). The result indicates the simultaneous excitation of localized surface plasmons (LSPs) of the chiral E-shaped structure and the diffractive behavior determined by periodic arrangement (that is, lattice resonance mode). Here, the position of lattice resonances is close to the Rayleigh anomaly (RA) wavelength of (, 0) orders for the normal incidence [35] since the resonator is surrounded by silica, metal, and water, which is not a homogeneous medium. The effective refractive index in our system is between the refractive index values of water, metal, and silica. Thus, the theoretical RA wavelength calculated in this work should be around 870 nm () [36], which is exactly close to the position of our absorption resonance wavelength 877 nm. 3D electric field distribution maps are presented in Fig. 8 (Appendix B). These results suggest that the absorption at 877 nm is triggered by a lattice resonance mode.
In contrast, from Figs. 2(e) and 2(g), we can see that RCP absorption is dominant at 1045 nm. The electric field is localized in the layer, which indicates a magnetic resonance; the electric field is also mainly concentrated around the horizontal arm of the E-shaped structure [Fig. 2(g)], which implies electric dipole resonance. Thus, this resonance can be attributed to a hybridization of an electric dipole resonance and a magnetic resonance. In summary, the CD peak located at 877 nm originated from lattice resonance and the CD valley at 1045 nm arose from a hybridization of electric dipole resonance and magnetic resonance.
Metallic nanoparticles can efficiently generate heat and raise the temperature of the surrounding environment in the presence of electromagnetic radiation [32,37]. The study of combining chiral absorbers with photothermal effects led to the concept of photothermal circular dichroism (CDT), which is defined as [31] where represents the local temperature increase created by the incidence of LCP and RCP light, as indicated by the subscript. The thermal CD effect is similar to optical CD since the light absorption process increases the temperature. Similarly, we can derive a formula for the photothermal factor, which is written as
The special photothermal response in liquid based on the CD effect is further investigated here, as shown in Fig. 3. The chiral photothermal properties are position-dependent and eventually reach a photothermal steady state with the prolonged irradiation time [38]. Figures 3(a)–3(c) plot the evolution of the average temperature rise of the entire system as a function of time at two CD peak positions. As the time increases, the temperature gradually rises and reaches a steady state. The maximum temperature rise of the proposed system is about 25 K with the input intensity of used here. It can be seen that the temperature under LCP incidence is always higher than that under RCP incidence at the first wavelength (877 nm) due to the selective absorption for LCP.
Figure 3.Photothermal effect of the chiral metasurface. Average temperature increases of the whole system as a function of time under LCP (orange) and RCP (cyan) illumination at the resonant wavelength of (a) 877 nm and (b) 1045 nm. (c) Photothermal circular dichroism as a function of time at 877 nm (magenta) and 1045 nm (blue). (d)–(f) Photo-induced temperature increase in the section at when . The data are recorded at (d) 877 nm and (e) 1045 nm under LCP (left) and RCP (right) illumination. (f) Spatial distribution of photothermal circular dichroism corresponding to (d) and (e).
Conversely, the opposite result is observed at another wavelength (1045 nm), as demonstrated in Fig. 3(b), where a higher temperature rise is obtained under RCP incidence. Figure 3(c) presents the photothermal CD spectrum as a function of time. It is clear that the photothermal CD holds different trends with a positive at 877 nm and a negative at 1045 nm, corresponding to the optical response discussed earlier. Figures 3(d) and 3(e) display the spatial maps of the photo-induced temperature of the plane at with , showing that the temperature rise under LCP incidence at 877 nm is much higher than that under RCP. At 1045 nm, there is a notable temperature rise under RCP irradiation. Due to the nonradiative decay of the plasmonic resonances, the local temperature increments are concentrated around the top chiral resonators, and they rapidly decrease when moving away from the top resonators in the lateral and vertical directions. Similar results of the temperature distribution in the plane at are shown in Fig. 9 (Appendix C). Since gold has high thermal conductivity, the temperature is almost evenly distributed in the nanoantennas. Figure 3(f) shows the photothermal CD maps corresponding to Figs. 3(d) and 3(e). The photothermal CD feature is still presented here with a maximum temperature difference of and at each excitation wavelength.
As a result, the system establishes a temperature gradient, resulting in a buoyancy-driven natural convection [39]. The convection is important for microfluidic analytical processes, active matter design, and molecular transport. In our structure, the CD effect is also exhibited in the optofluidic channels. Figure 4(a) illustrates the evolution of velocity as a function of wavelength. The peak locations of the velocity coincide with the optical absorption spectrum, indicating the same peak wavelengths. As a result, the velocity CD and factor also exhibit similar characteristics [Fig. 4(b)], with maximum and minimum values of located at 877 nm and 1045 nm, respectively. Figures 4(c)–4(h) display the 2D velocity spatial distributions in the plane at under the two positions. To highlight the water flow morphology, we have removed part of the geometry and used a fake cyan background. The velocity field distribution is represented by green double arrows, with their length indicating the magnitude. Notably, clear fluid motion appears under LCP illumination at 877 nm, while the arrows are too small to see under RCP incidence [Figs. 4(c) and 4(d)]. In contrast, vigorous motion emerges under RCP illumination at 1045 nm, while the arrows are barely visible under LCP incidence [Figs. 4(f) and 4(g)]. We plot the 2D optofluidic CD and factor spectra in Figs. 4(e) and 4(h), which we calculated as [32] where and are the velocity of water under the illumination of LCP and RCP, respectively. The velocity CD maintains a maximum value of approximately 0.01 nm/s but with opposite directions. We want to highlight that the low velocity observed in our study can be attributed to the low Reynolds number, as this research only serves as a proof-of-concept demonstration. However, it is worth noting that there are several approaches available to enhance the velocity up to the scale of μm/s [32].
Figure 4.Thermally-induced fluid motion of the water. (a) Velocity spectra with LCP (pink) and RCP (gray) illumination. (b) Calculated velocity CD (blue) and factor (purple) spectra. (c)–(h) Velocity patterns (double arrows) in the section at . Other geometry is removed, and a false background highlights the fluid motion. Simulated fluid convection at (c), (d) 877 nm and (f), (g) 1045 nm under (c), (f) LCP and (d), (g) RCP illumination. (e), (h) Velocity CD profiles at 877 nm and 1045 nm, respectively. The data were recorded at .
To explore the mechanism of chiral optofluidic, we conducted a study on the three-dimensional temperature distribution of the resonator, as illustrated in Fig. 5. As previously mentioned, Au exhibits high thermal conductivity, but there is still a temperature gradient inside the resonator, resulting in an asymmetric distribution of fluid convection. It should be noted that the temperature legend in Fig. 5 only indicates the temperature gradient and not the actual temperature. Our findings indicate that due to the chirality of the structure and the selective absorption of CPL, the 3D temperature distribution of the resonator is nonuniform and varies at the two wavelengths. In this case, the resonator serves as a heat source with a power output , written as [40]
Figure 5.Chiral fluid convection in section. (a)–(d) 3D temperature distribution maps in the resonator. The legend here only represents the temperature gradient instead of the actual temperature. (e)–(h) Velocity patterns (streamlines) overlaid the temperature gradient of the resonator in the section at , as indicated by the red dashed line in the inset. (a), (b) and (e), (f) are recorded at the wavelength of 877 nm under (a), (e) LCP and (b), (f) RCP incidence. (c), (d) and (g), (h) are recorded at the wavelength of 1045 nm under (c), (g) LCP and (d), (h) RCP illumination.
Figures 5(e)–5(h) present velocity patterns (streamlines) overlaying the temperature gradient of the section at (indicated by the red dashed line in the inset) to illustrate the asymmetric fluid convection. The results show that convection emerges with the same distribution under similar temperature gradients and identical heat source locations. In contrast, Fig. 10 (Appendix D) displays the velocity patterns of the section at , where three heat sources in the section result in different fluid streamlines. These results indicate that the flow field’s distribution primarily depends on the heat source location, and the Navier–Stokes equation describes the speed magnitude as [41] where is the viscosity of water and denotes the external buoyancy force, which is expressed as [41] where is the dilatation coefficient of water, is the gravitational acceleration, is the temperature increase, and is the upward unit vector along the direction. According to the equations mentioned, the velocity magnitude increases to a certain extent with a rising temperature. While the location of the heat source mainly determines the direction of the velocity, these findings provide insight into generating various fluid morphologies, which can aid the advancement of optofluidics research.
Figure 6 offers a comparative analysis of factors obtained in different modules. As observed in Fig. 6, the optical absorption factor curve closely aligns with the velocity factor curve. Furthermore, the inset illustrates the evolution of factor as a function of time. It is noticeable that the factor remains relatively stable for the CA or CB enantiomers over time. Therefore, the results further corroborate that the factor is an inherent property of the structure, which remains unaffected due to the extension of time or changes in the external conditions. In this work, the maximum value of the factor is close to 1 and exhibits a pair of opposite values, which underscores the special chirality of the proposed metasurface.
Figure 6. factor spectra. Optical absorption factor (pink) and velocity factor (gray) of the CA enantiomer. The inset shows the evolution of the photothermal factor as a function of time in the CA (blue) and CB (purple) enantiomers.
Figure 7.(a) Simulated optical response of CB enantiomer under LCP (blue) and RCP (cyan) illumination. (b) CD spectrum of CB system. (c) factor spectrum of CB system.
Figure 8.Three-dimensional cross-section diagram of the electromagnetic response at the two wavelengths (a), (b) 877 nm and (c)–(e) 1045 nm under (a), (b) LCP and (c)–(e) RCP incidence. Simulated electric intensity profiles are taken from the section at (a), (d) and (b), (e) . (c) Spatial electric intensity profiles taken from the section at .
Figure 9.Photo-induced temperature increase at the two wavelengths (a), (b) 877 nm and (c), (d) 1045 nm in the vertical cross-sections at , as the red dashed line in the inset shows. (a), (c) and (b), (d) are recorded under LCP and RCP incidence, respectively. The incident light flux is . The data are given at the time of .
Figure 10.Velocity patterns (streamlines) overlaying the temperature gradient of the resonator in -section at , as indicated by the red dashed line in the inset. (a), (b) and (c), (d) are recorded at the wavelengths of 877 nm and 1045 nm under (a), (c) LCP and (b), (d) RCP incidence.
Multiple equations, including electromagnetic, heat transfer, and fluid flow, can describe the process of thermally-induced fluid flow. This paper employs COMSOL Multiphysics to solve the coupling problems. The electromagnetic response of the proposed structure is carried out by solving Maxwell’s equation using the electromagnetic wave frequency domain module. Full-wave electromagnetic simulations are implemented to investigate the optical response of the system. Periodic boundary conditions are applied for the and directions. To simulate CPL, two orthogonally polarized plane waves with a phase difference of 90° are set, with the light vertically hitting the object from the upper surface. Perfectly matched layer (PML) boundary conditions are used along the direction to eliminate the boundary scattering. For the spatial-temporal distribution calculation, the ambient temperature in heat transfer was set to . The physical parameters of gold are taken from this literature [42].
4. CONCLUSION
This paper introduces a method to obtain distinct thermal circular dichroism () and optofluidics circular dichroism () using an enantiomeric metasurface absorber. The calculated CD values can be approximately and at the wavelengths of 877 nm and 1045 nm, respectively. The corresponding and are , and , . This approach allows for the converse absorption and light conversion of LCP and RCP without altering the geometric chirality. Furthermore, the fluid actuation properties explored in this study herald the potential for new applications for the adjustable CD effect in polarization-sensitive optofluidics. The structure exhibits two CD bands, making it suitable for use in multispectral plasmon-enhanced infrared spectroscopy. Chiral metastructures featuring dual or multiple bands hold significant promise for a range of applications, including selective optical filtering, multiplexed detector arrays, and biochemical sensing. Particularly in mid-infrared spectroscopy, the simultaneous observation of various spectral fingerprint regions, each indicative of distinct chemical or biological entities, is highly valuable. The capacity to simultaneously track multiple CD bands is essential for correlating and analyzing structural variations across different molecular areas, which is crucial for accurately identifying molecular species. This capability could also facilitate the detection and detailed analysis of complex biological units, such as cells or bacteria. Additionally, the light absorption by the structure can lead to heat generation, rendering it useful for multispectral photothermal imaging or as an emitter, especially in the infrared region. In conclusion, the generated heat can be employed to manipulate liquids or soft materials. The method outlined here is poised to propel forward the development of chiral optical devices and bolster applications in chiral sensing, optofluidics, and bioanalysis.
APPENDIX A
The optical response of the CB enantiomer is studied here, as shown in Fig. 7. At 877 nm, a stronger absorption of RCP incidence is observed, while at 1045 nm, the absorption of LCP incidence is dominant. As a result, a negative CD of approximately −0.6 is observed at the wavelength of 877 nm. A positive CD was obtained at 1045 nm with a value of approximately +0.6. The g-factor spectrum also exhibits opposite trends to the CA system.
APPENDIX B
The three-dimensional electric field distribution maps are plotted in Fig. 8 to better demonstrate the characteristics of circular polarization-selective absorption. At the wavelength of 877 nm, the CA system exhibits a significant electric field enhancement effect under LCP incidence. On the contrary, at a wavelength of 1045 nm, the CA system exhibits a stronger field enhancement effect under RCP incidence.
APPENDIX C
We investigated the photothermal effect for the xz cross-sections at , as shown in Fig. 9. There is a significant temperature rise near the resonator, which decreases towards the surrounding area in the vertical direction. At the wavelength of 877 nm, a significant temperature rise can be observed under LCP incidence. In contrast, higher temperature rise under RCP illumination is obtained at the wavelength of 1045 nm.
APPENDIX D
The influence of heat sources on fluid flow is further investigated here, as shown in Fig. 10. There are three different heat sources in the xz cross-section at . It can be seen that the streamlines show an irregular distribution, suggesting the influence of heat sources on the velocity field.
 AI Video Guide
  AI Picture Guide
 AI One Sentence