• Photonics Research
  • Vol. 7, Issue 5, 526 (2019)
Min Liu1, Wending Zhang1、*, Fanfan Lu1, Tianyang Xue1, Xin Li1, Lu Zhang1, Dong Mao1, Ligang Huang2, Feng Gao3, Ting Mei1、4, and Jianlin Zhao1
Author Affiliations
  • 1MOE Key Laboratory of Material Physics and Chemistry under Extraordinary Conditions and Shaanxi Key Laboratory of Optical Information Technology, School of Science, Northwestern Polytechnical University, Xi’an 710072, China
  • 2MOE Key Laboratory of Optoelectronic Technology and Systems, Chongqing University, Chongqing 400044, China
  • 3MOE Key Laboratory of Weak-Light Nonlinear Photonics, TEDA Applied Physics Institute and School of Physics, Nankai University, Tianjin 300457, China
  • 4e-mail: ting.mei@ieee.org
  • show less
    DOI: 10.1364/PRJ.7.000526 Cite this Article Set citation alerts
    Min Liu, Wending Zhang, Fanfan Lu, Tianyang Xue, Xin Li, Lu Zhang, Dong Mao, Ligang Huang, Feng Gao, Ting Mei, Jianlin Zhao. Plasmonic tip internally excited via an azimuthal vector beam for surface enhanced Raman spectroscopy[J]. Photonics Research, 2019, 7(5): 526 Copy Citation Text show less
    (a) Sketch map of the Ag-NPs-coated fiber probe; (b) distribution characteristics of the Ag-NPs on the cross section of the fiber probe; (c) dispersion curve of HE11x/y and TE01 with the decrease in the fiber radius in the bare tapered fiber; energy distributions of (d) HE11x/y and (e) TE01 along the Ag film-coated tapered fiber.
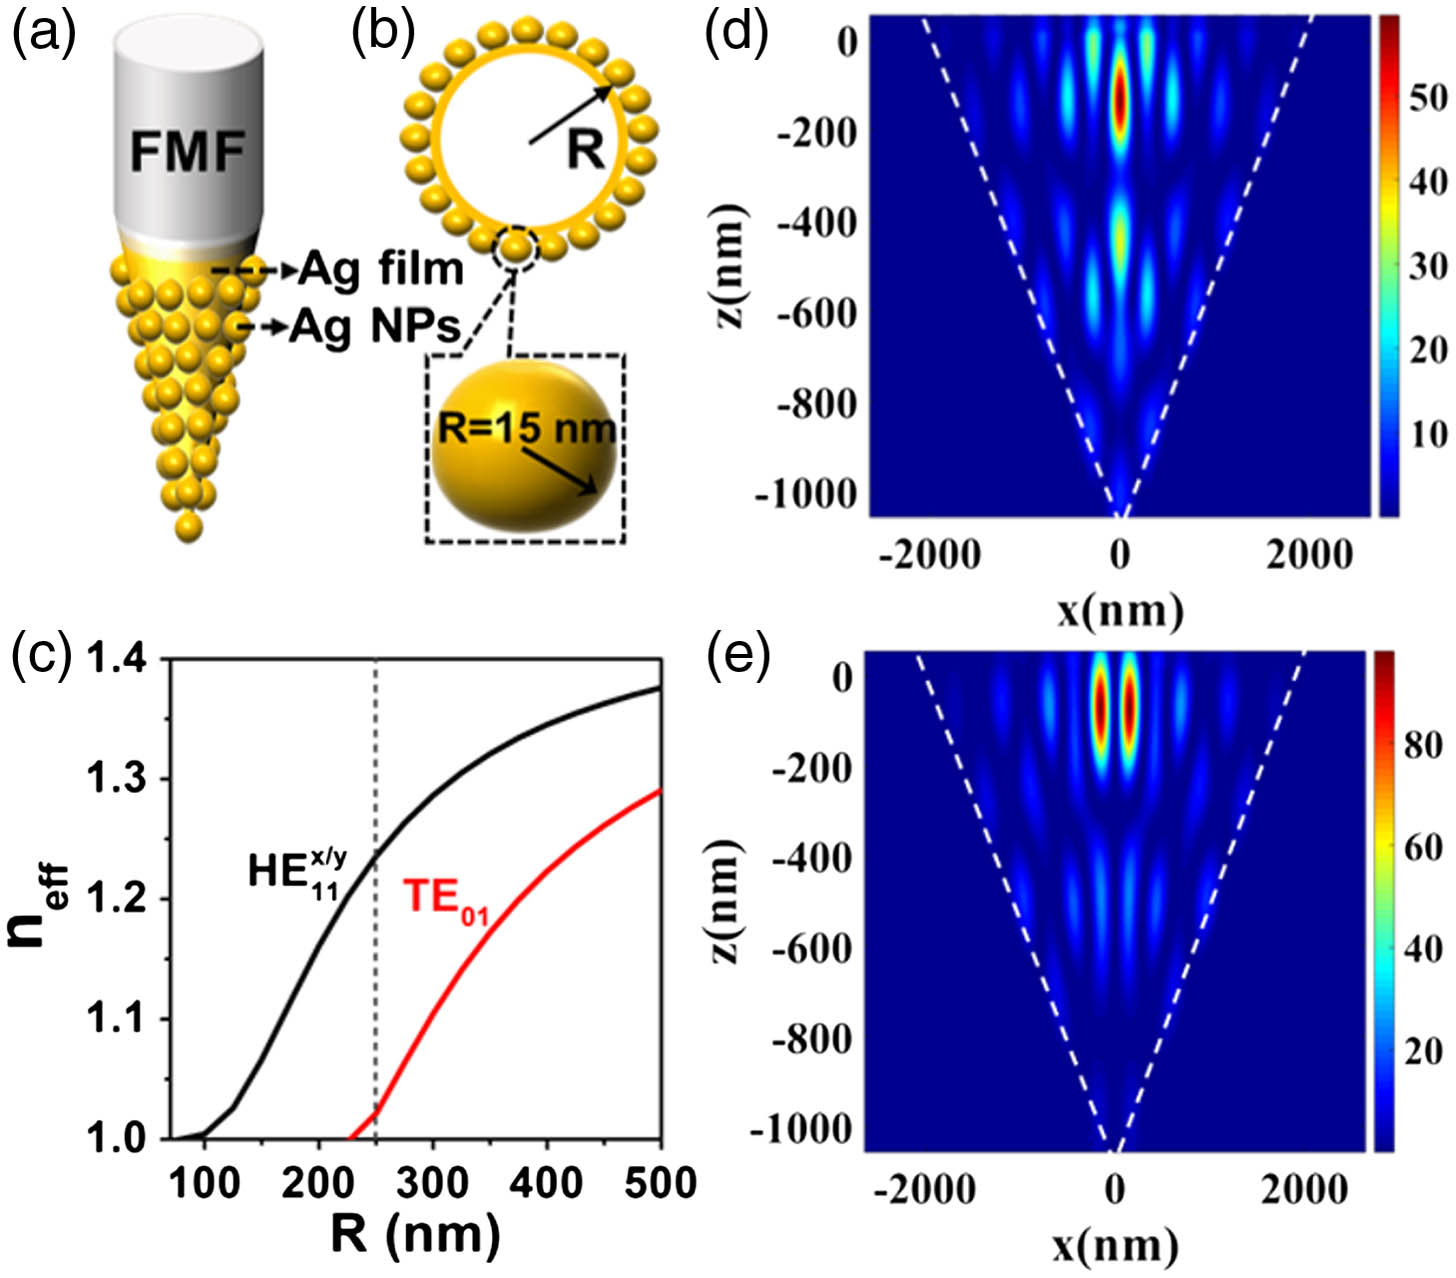
    Fig. 1. (a) Sketch map of the Ag-NPs-coated fiber probe; (b) distribution characteristics of the Ag-NPs on the cross section of the fiber probe; (c) dispersion curve of HE11x/y and TE01 with the decrease in the fiber radius in the bare tapered fiber; energy distributions of (d) HE11x/y and (e) TE01 along the Ag film-coated tapered fiber.
    (a)–(c) Sketch map of the Ag-NPs-coated fiber probe excited by three vector modes, HE11x, HE11y, and TE01, respectively, on a cross section of the fiber probe with R=250 nm; (d)–(f) electric intensity distributions of the local surface plasmon modes corresponding to (a)–(c), respectively.
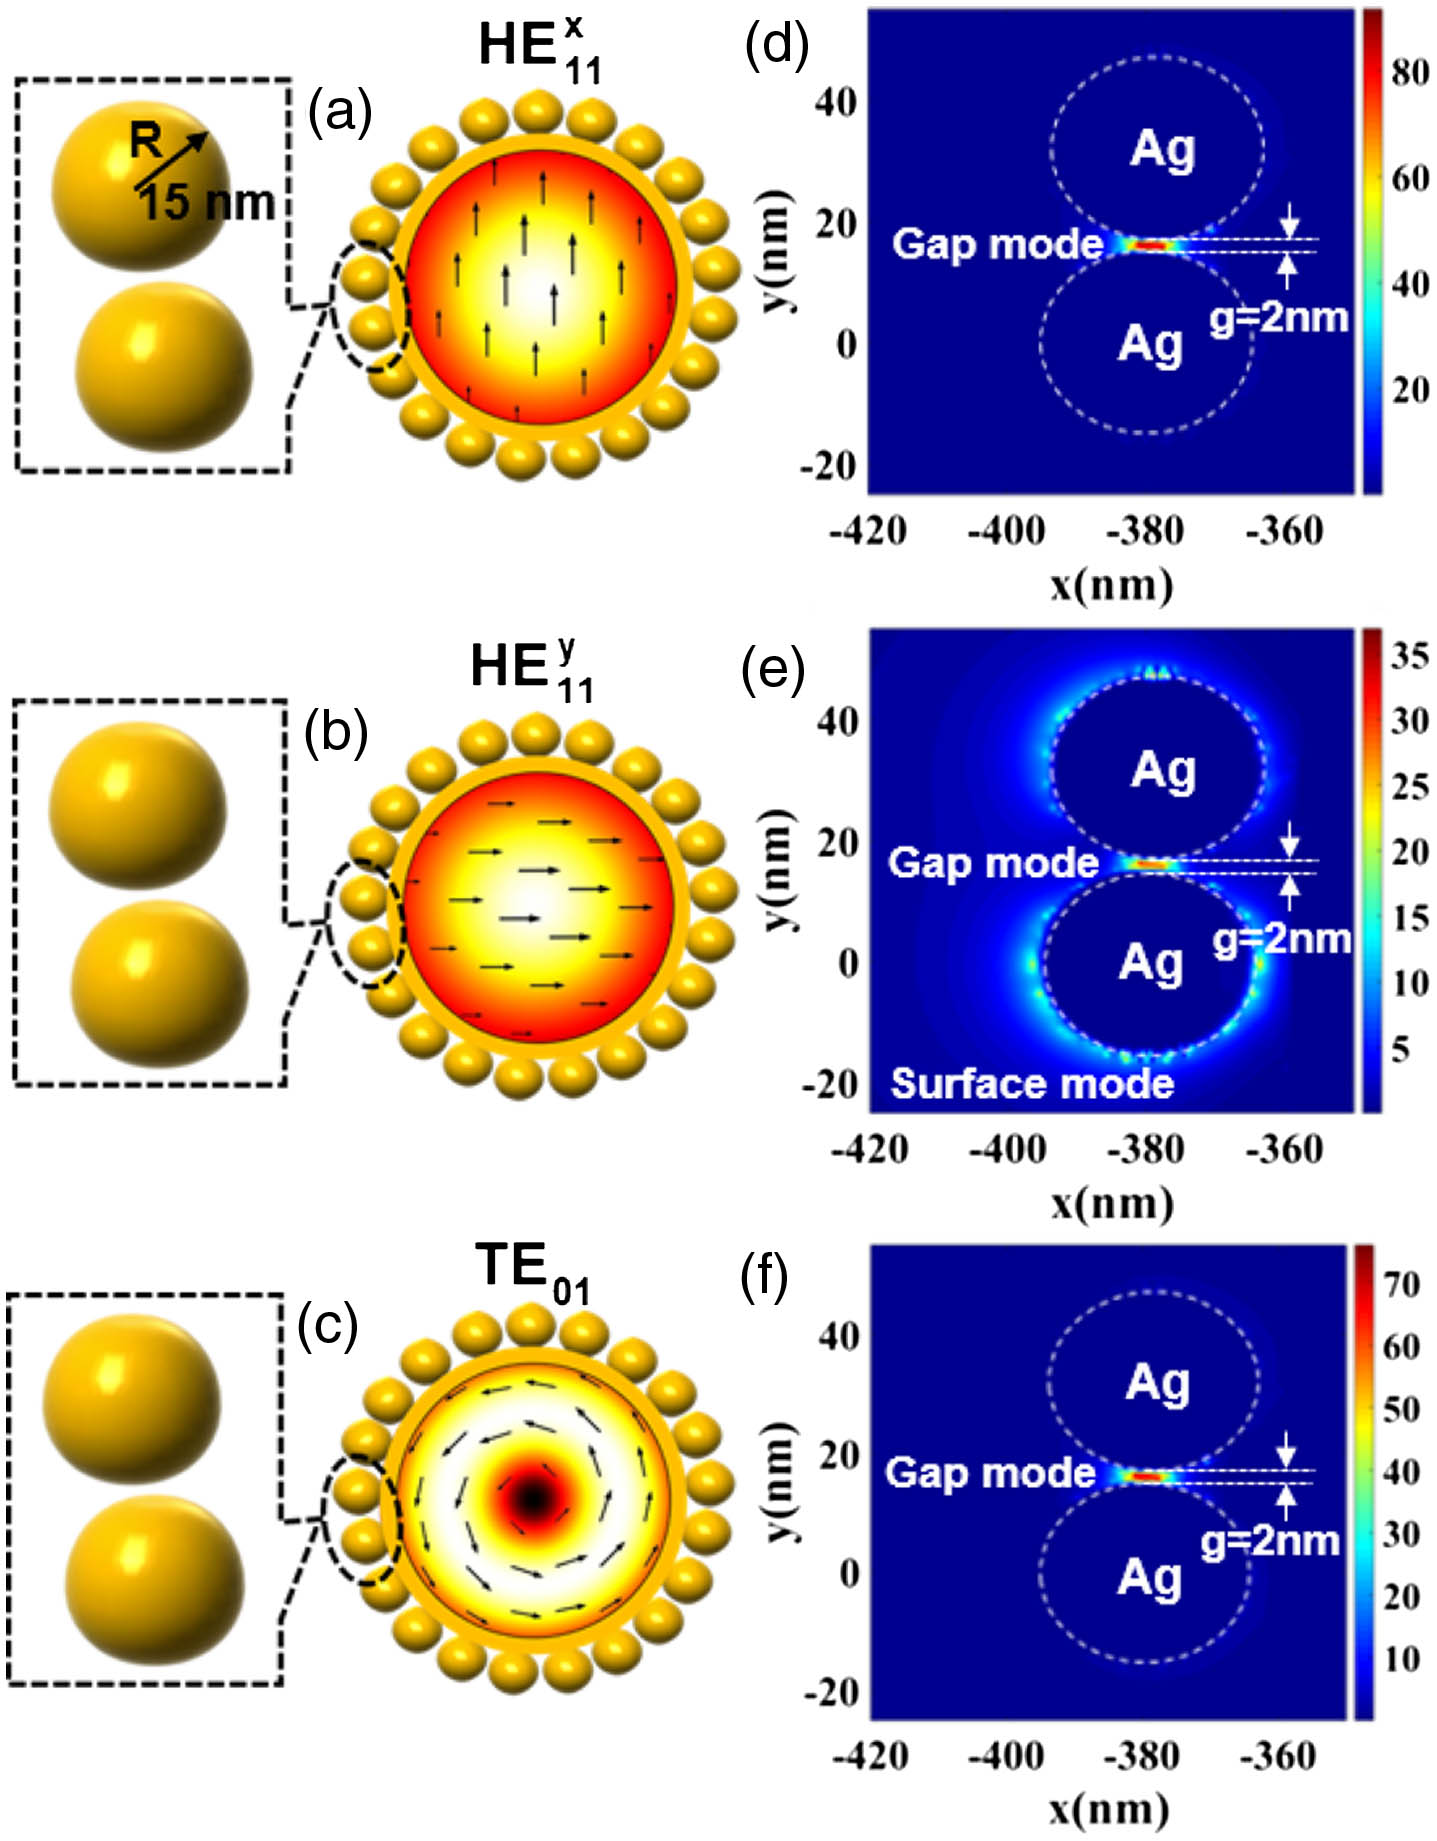
    Fig. 2. (a)–(c) Sketch map of the Ag-NPs-coated fiber probe excited by three vector modes, HE11x, HE11y, and TE01, respectively, on a cross section of the fiber probe with R=250  nm; (d)–(f) electric intensity distributions of the local surface plasmon modes corresponding to (a)–(c), respectively.
    Optical microscope images of (a) the bare tapered fiber and (b) the Ag-NPs-coated tapered fiber; (c) SEM image of the tip area of the Ag-NPs-coated tapered fiber; (d) partial enlargement of the surface of the Ag-NPs-coated fiber tip; (e) EDS of the Ag-NPs coating of the SERS fiber probe.
    Fig. 3. Optical microscope images of (a) the bare tapered fiber and (b) the Ag-NPs-coated tapered fiber; (c) SEM image of the tip area of the Ag-NPs-coated tapered fiber; (d) partial enlargement of the surface of the Ag-NPs-coated fiber tip; (e) EDS of the Ag-NPs coating of the SERS fiber probe.
    (a) Sketch map of experimental setup for SERS detection using the Ag-NPs-coated fiber tip internally excited via an AVB. Transverse mode intensity distribution of (b) HE11 and (c) TE01. (d)–(g) Polarization distribution examination results of the generated TE01 mode; (h) Raman spectra of MG (10−5 M) molecules absorbed on the surface of the Ag-NPs-coated fiber probe internally excited with HE11 (black curve) and TE01 (red curve) modes, respectively. Integration time is 10 s, and excitation power is 3.5 mW. (i) Raman spectra of MG with different concentrations (10−9 M, 10−10 M, and 10−11 M) adsorbed on the surface of the Au-NPs-coated fiber probe excited via TE01 mode and Raman spectrum of 10−11 M MG solution adsorbed on the surface of Au-NPs-coated fiber probe (pink curve) excited via HE11 mode. The integration time is 10 s, and the excitation power is 3.5 mW.
    Fig. 4. (a) Sketch map of experimental setup for SERS detection using the Ag-NPs-coated fiber tip internally excited via an AVB. Transverse mode intensity distribution of (b) HE11 and (c) TE01. (d)–(g) Polarization distribution examination results of the generated TE01 mode; (h) Raman spectra of MG (105  M) molecules absorbed on the surface of the Ag-NPs-coated fiber probe internally excited with HE11 (black curve) and TE01 (red curve) modes, respectively. Integration time is 10 s, and excitation power is 3.5 mW. (i) Raman spectra of MG with different concentrations (109  M, 1010  M, and 1011  M) adsorbed on the surface of the Au-NPs-coated fiber probe excited via TE01 mode and Raman spectrum of 1011  M MG solution adsorbed on the surface of Au-NPs-coated fiber probe (pink curve) excited via HE11 mode. The integration time is 10 s, and the excitation power is 3.5 mW.
    (a) Raman spectra of the MG solution (10−5 M) absorbed on the surface of the silver-coated fiber tip and internally excited via HE11 mode (black curve) and TE01 mode (red curve) after the probe being stored in a lab environment for 3 h. The integration time is 10 s. The excitation power is 3.5 mW. (b) Raman spectra as a function of storage time, recorded at 10 min intervals for 60 min, for the sample stored in a lab environment for 3 h before measuring the Raman spectra under TE01 mode excitation. The integration time is 5 s. The excitation power is 3.5 mW. (c) Time variation of intensity of the 1613.5 cm−1 band as shown in (b).
    Fig. 5. (a) Raman spectra of the MG solution (105  M) absorbed on the surface of the silver-coated fiber tip and internally excited via HE11 mode (black curve) and TE01 mode (red curve) after the probe being stored in a lab environment for 3 h. The integration time is 10 s. The excitation power is 3.5 mW. (b) Raman spectra as a function of storage time, recorded at 10 min intervals for 60 min, for the sample stored in a lab environment for 3 h before measuring the Raman spectra under TE01 mode excitation. The integration time is 5 s. The excitation power is 3.5 mW. (c) Time variation of intensity of the 1613.5  cm1 band as shown in (b).
    (a)–(c) Raman spectra of MG (10−5 M) detected with three different Au-NPs-coated fiber probes and internally excited via HE11 and TE01 modes, respectively. The integration time is 10 s. The excitation power is 3.5 mW. (d) Histogram of the magnification calculated with the intensity of the 1613.5 cm−1 band of the three SERS fiber probes excited using TE01 and HE11 modes.
    Fig. 6. (a)–(c) Raman spectra of MG (105  M) detected with three different Au-NPs-coated fiber probes and internally excited via HE11 and TE01 modes, respectively. The integration time is 10 s. The excitation power is 3.5 mW. (d) Histogram of the magnification calculated with the intensity of the 1613.5  cm1 band of the three SERS fiber probes excited using TE01 and HE11 modes.
    Min Liu, Wending Zhang, Fanfan Lu, Tianyang Xue, Xin Li, Lu Zhang, Dong Mao, Ligang Huang, Feng Gao, Ting Mei, Jianlin Zhao. Plasmonic tip internally excited via an azimuthal vector beam for surface enhanced Raman spectroscopy[J]. Photonics Research, 2019, 7(5): 526
    Download Citation