Abstract
The synergy of a plasmonic tip and fiber-based structure light field excitation can provide a powerful tool for Raman examination. Here, we present a method of Raman spectrum enhancement with an Ag-nanoparticles (Ag-NPs)-coated fiber probe internally excited via an azimuthal vector beam (AVB), which is directly generated in a few-mode fiber by using an acoustically induced fiber grating. Theoretical analysis shows that gap mode can be effectively generated on the surface of the Ag-NPs-coated fiber probe excited via an AVB. The experimental result shows that the intensity of Raman signal obtained with analyte molecules of malachite green by exciting the Ag-NPs-coated fiber probe via an AVB is approximately eight times as strong as that via the linear polarization beam (LPB), and the activity of the AVB-excited fiber probe can reach , which cannot be achieved by LPB excitation. Moreover, the time stability and reliability are also examined, respectively.1. INTRODUCTION
Surface enhanced Raman spectroscopy (SERS) has been widely exploited in the fields of chemistry [1], biology [2], materials [3], superresolution imaging [4], etc., due to possessing the ability of significantly improving the detection limit of Raman spectroscopy, which is called the fingerprint of molecules. Based on the localized surface plasmon resonance (LSPR) effect [5–7], the great enhancement of the electromagnetic (EM) field in the vicinity of metallic nanostructures dominates the SERS mechanism [8–10]. By optimizing the surface morphology of metallic nanostructures and illumination methods, SERS sensitivity can reach even the single molecule level [11–13].
Up to now, many metallic nanostructures, i.e., nanospheres [14], nanorods [15], and nanocubes [16], have been employed as SERS substrates [17–19]. Nanoparticles (NPs) are some of the most commonly used nanostructures because of their excellent activity and easy preparation [17]. The NPs-based SERS substrates, such as dimers [20], trimers [21], or NPs-on-film structures [22], have attracted wide attention for presenting strong electric field enhancement induced by the gap mode [23] in nanogaps between adjacent NPs or between NPs and a film. Importantly, when NPs-based structures are deposited on the surface of a tapered fiber [24–27], an SERS fiber probe is formed and can be used to increase the sensitivity of Raman examination with the advantages of high efficiency, remote examination capability, and cost effectiveness. Different geometries and structures [28,29] of fiber probes have been proposed to optimize SERS performance. However, there lacks research on different modes of in-fiber excitation light, which would be an important breakthrough to enhance the SERS signal due to dependence of excitation of localized surface plasmon modes on the polarization of light [30,31].
In free space, the spatially structured light field has been adopted to improve metallic nanostructure-based Raman scattering intensity due to the great influences of illumination methods on the excitation of localized surface plasmon modes [32,33]. An azimuthal vector beam (AVB) is a typical structured light field in which the polarization direction is tangential on the cross section of the beam [34]. The AVB has been used in tip-enhanced Raman spectroscopy (TERS) and shows considerable improvement when it excites the NP at the apex of the atomic force microscope (AFM) tip [35,36]. However, in fiber, the AVB has not been used in enhancing Raman spectrum detection due to difficulty in generating the AVB in fiber caused by the boundary condition constraint. Considering the special polarization distribution of the AVB, it is promising to design an active NPs-based plasmonic tip for AVB excitation to enhance fiber SERS sensitivity and systematic research to optimize and understand that the AVB-enhanced fiber SERS is necessary for high-sensitivity detection.
Sign up for Photonics Research TOC. Get the latest issue of Photonics Research delivered right to you!Sign up now
In addition, the fiber probes are usually made of multimode fiber [37] with thousands of vector modes in the core [38]. The superposition among so many vector modes leads to a very complex and uncertain polarization distribution and low mode purity, which makes it impossible to accurately explain the electric field enhancement mechanism. Thus, it is necessary to guarantee the high mode purity of excitation light in fiber.
In this paper, an SERS fiber probe is fabricated by using a few-mode fiber (FMF) internally excited via an AVB, which is directly generated in the FMF by using an acoustically induced fiber grating (AIFG). The theoretical analysis shows that the gap mode can be effectively and uniformly generated on the surface of the Ag-NPs-coated fiber tip excited via an AVB. In the experiment, we have achieved approximately eight times stronger Raman spectrum via an AVB than that of a linearly polarized beam (LPB) with excellent time stability and repeatability, where malachite green (MG) is used as the target analyte. The detection sensitivity under AVB excitation can reach , which cannot be achieved by LPB excitation.
2. MATERIALS AND METHODS
A. Simulation Methods
The commercial software MODE Solutions was used to calculate the dispersion curves of the LPB () and AVB () as the radius of the bare tapered fiber decreases, as shown in Fig. 1(c). The energy distributions of the LPB and AVB along the Ag-film-coated tapered fiber without NPs deposited on the film surface, as shown in Figs. 1(d) and 1(e), respectively, were simulated using the three-dimensional finite-difference time domain (3D FDTD, Lumerical) method. Furthermore, the electric intensity distributions of the local surface plasmon modes on the surface of the Ag-NPs-coated fiber probe, as shown in Figs. 2(d)–2(f), were also simulated with the 3D FDTD method.
B. Fabrication of the SERS Fiber Probe
The SERS fiber tip was fabricated by a step-index FMF, with a core radius of and a cladding radius of , in the visible band. The heating–pulling method was used to prepare the tapered fiber [39]. The photochemical deposition method [40] was adopted to deposit the Ag NPs onto the surface of the tapered fiber. The bare tapered fiber was vertically immersed into the reaction mixture while being internally illuminated by a laser beam. The reaction solution was a mixture including silver ammonia solution (0.02 g/mL solution and a moderate amount of ammonia water) and potassium sodium tartrate (0.1 g/mL) with a volume ratio of 1:1. The laser power was kept at 500 μW during the deposition process of 30 min. The shape of the tapered fiber was characterized by an optical microscope. The surface topography of the Ag-NPs-coated fiber tip was characterized by a scanning electron microscope (SEM) [Fig. 3(c)]. Energy dispersive spectroscopy (EDS) was used to analyze the chemical component of the fabricated plasmonic tip.
C. Generation of the AVB in the FMF
The AIFG [41–43] was adopted to generate the AVB in the FMF. The laser beam (He–Ne laser, 632.8 nm, CW, 20 mW) was coupled into the FMF using a micro-objective. The polarization orientation of the laser beam was adjusted through a half-wave plate. A mode stripper was used to purify the light to the LPB in the core by filtering out the high-order modes through critical bending loss. The diameter of the unjacketed FMF for forming the AIFG was etched to 30 μm by hydrofluoric acid to adjust the resonance wavelength and increase the overlap between the acoustic and optical waves, thus increasing the coupling efficiency of the AIFG within the 50 mm long etched segment. An acoustic transducer was used to generate an acoustic flexural wave to induce the AIFG. Based on the polarized dependence vector mode coupling characteristics, the AIFG could convert the LPB to an AVB, and the mode intensity distribution of the AVB was recorded by a CCD.
D. Raman Spectrum Detection
The Ag-NPs-coated fiber tip was immersed in the MG (dispersed in alcohol) solutions for 5 min and then taken out for natural air drying. The in-fiber AVB was used to excite Raman scattering of MG adsorbed at the apex of the tip. A laser line filter was put after the He–Ne laser beam to eliminate the side modes. The sketch map of the Ag-NPs-coated fiber probe internally excited via the AVB for SERS activity examination is shown in Fig. 4(a), in which the SERS signal was collected via a micro objective (MO; ) and then coupled into a spectrometer (Andor SR-500i-B1-R-1F1).
3. RESULTS AND DISCUSSION
A. Characterization of the SERS Fiber Probe
Figure 3(a) is the optical microscope image of the tapered fiber fabricated by the heating–pulling method [39]. Ag NPs, as an excellent plasmonic material in the visible band, are transferred onto the surface of the tapered fiber by using a laser-induced chemical deposition method [40]. The optical microscope image of the Ag-NPs-coated tapered fiber is shown in Fig. 3(b). Figure 3(c) is the SEM image of the tip area of the fabricated SERS fiber probe. The partial enlargement of the surface of the Ag-NPs-coated fiber tip is shown in Fig. 3(d); note that an Ag film is coated on the surface of the tapered fiber, and the Ag NPs, with radius of , are deposited on the surface of the silver film. In addition, according to the EDS shown in Fig. 3(e), the chemical component of NPs coated at the surface of the tip is silver.
B. Theoretical Analysis of the Electric Field Enhancement Mechanism
Figure 1(a) is the sketch of the Ag-NPs-coated fiber probe established based on the morphology characterization depicted in Fig. 3. In order to simplify the theoretical analysis, on a cross section of the tapered fiber region, it can be considered that there is an Ag film on the surface of the tapered fiber, and Ag NPs with radius are distributed on the surface of the Ag film, as shown in Fig. 1(b). Figure 1(c) depicts the dispersion curve of the two lowest-order vector modes (, ) with the decrease in the fiber radius at a wavelength of 632.8 nm. Note that the effective refractive index of is larger than that of , and two vector modes are, respectively, cut off at () and 225 nm (), revealing that the energy distribution of is more concentrated than that of , and the cutoff radius of is smaller than that of . Furthermore, the energy distributions of the and modes along the Ag-film-coated tapered fiber are also simulated at a wavelength of 632.8 nm, as, respectively, shown in Figs. 1(d) and 1(e), which is coincident with the theoretical analysis depicted in Fig. 1(c).
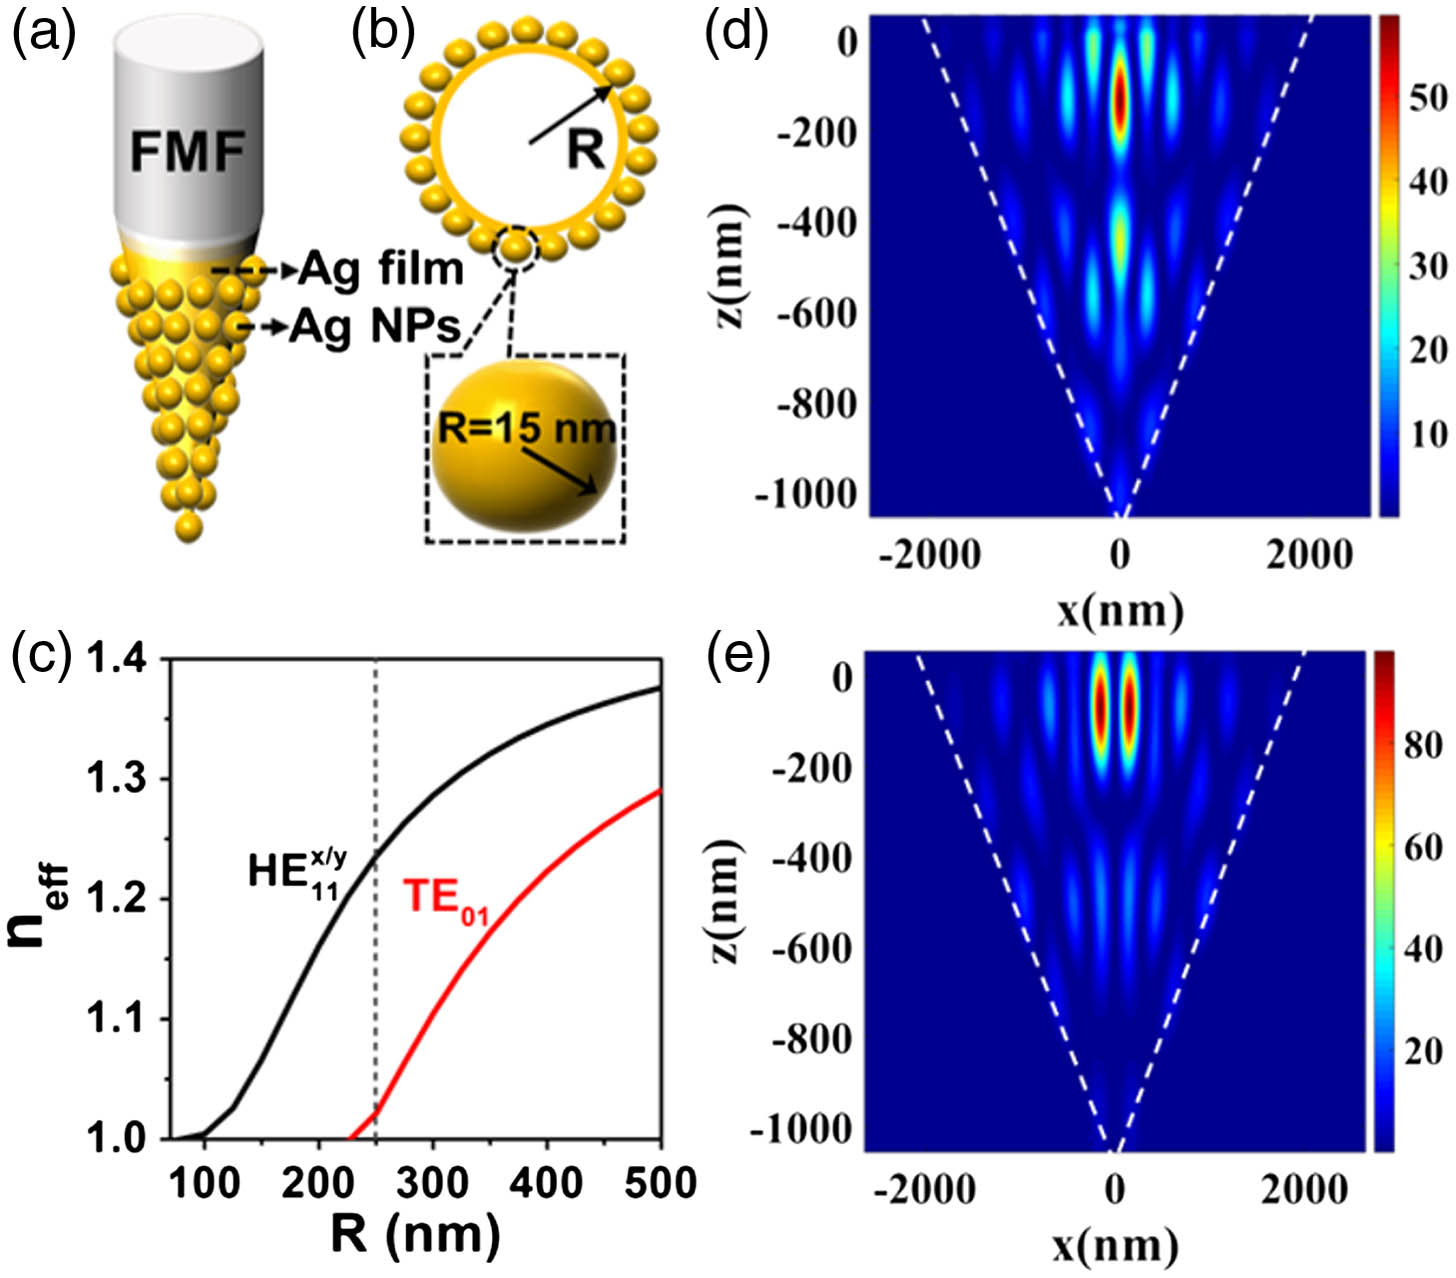
Figure 1.(a) Sketch map of the Ag-NPs-coated fiber probe; (b) distribution characteristics of the Ag-NPs on the cross section of the fiber probe; (c) dispersion curve of and with the decrease in the fiber radius in the bare tapered fiber; energy distributions of (d) and (e) along the Ag film-coated tapered fiber.

Figure 2.(a)–(c) Sketch map of the Ag-NPs-coated fiber probe excited by three vector modes, , , and , respectively, on a cross section of the fiber probe with ; (d)–(f) electric intensity distributions of the local surface plasmon modes corresponding to (a)–(c), respectively.
Figure 3.Optical microscope images of (a) the bare tapered fiber and (b) the Ag-NPs-coated tapered fiber; (c) SEM image of the tip area of the Ag-NPs-coated tapered fiber; (d) partial enlargement of the surface of the Ag-NPs-coated fiber tip; (e) EDS of the Ag-NPs coating of the SERS fiber probe.
To compare the electric field enhancement characteristic of the local surface plasmon modes excited by and modes, the cross section of the Ag-NPs-coated fiber probe with a tapered fiber radius of is selected because the and modes are not cut off at this position, as shown in Fig. 1(c). Figures 2(a)–2(c) show the electric field enhancement characteristics of the local surface plasmonic modes on the surface of the Au-NPs-coated fiber probe calculated in three cases, because is a strictly double-degenerated vector mode including and with orthogonally linearly polarized directions, and has azimuthal polarization distribution. In the case of excitation, the gap mode can be excited between two adjacent Ag NPs with a nanoscale of , as shown in Fig. 2(d), when the linear polarization direction of is approximately parallel to the center line of two adjacent Au NPs. As exhibited in Fig. 2(e), the surface and gap modes can be excited simultaneously with the linear polarization direction of approximately perpendicular to the center line of two adjacent Au NPs, but the electric field enhancement factor is smaller than that obtained by parallel excitation, as shown in Fig. 2(d). Based on the simulation results shown in Figs. 2(d) and 2(e), the gap mode can possess a large electric field enhancement factor only when the linearly polarized excitation light has a polarization direction parallel to the center line of two adjacent Au NPs. In other words, the gap mode with an optimized electric field enhancement factor cannot be effectively excited by the linearly polarized modes () at any position of the cross section of the Ag-NPs-coated fiber probe.
Furthermore, the electric field intensity distribution between two adjacent Ag NPs excited by mode is shown in Fig. 2(f). The gap mode between any two adjacent Ag NPs on a cross section of the Ag-NPs-coated fiber probe can be effectively excited by the mode due to possessing the azimuthally polarized distribution, leading to significant enhancement compared with , even though the gap mode is not increased compared with that shown in Fig. 2(d). In other words, mode can excite the gap mode with the uniform electric field enhancement factor on the cross section of the Ag-NPs-coated fiber probe, but only the mode with linear polarization direction parallel to the center line of two adjacent Ag NPs can excite the gap mode with an electric field intensity equal to excitation. Therefore, the Raman signal intensity obtained by mode excitation is larger than that by mode excitation, because exciting the Ag-NPs-coated fiber probe via the mode can obtain a larger SERS active surface than by mode excitation.
C. SERS Detection Excited by a Fiber-Based AVB
The sketch of the experimental setup for SERS detection using the Ag-NPs-coated fiber probe internally excited via an AVB is shown in Fig. 4(a), in which the SERS signal was collected via an MO (40×) and then coupled into a spectrometer (Andor SR-500i-B1-R-1F1). In this experiment, the AVB is directly generated in an FMF via an AIFG reported in our previous work [41–43]. Based on the polarized dependence vector mode coupling characteristic of the AIFG, the linearly polarized fundamental vector mode , as shown in Fig. 4(b), is coupled as the azimuthal vector mode (), whose transverse mode intensity distribution is depicted in Fig. 4(c), and the polarization distribution examination results are shown in Figs. 4(d)–4(g), respectively.
Figure 4.(a) Sketch map of experimental setup for SERS detection using the Ag-NPs-coated fiber tip internally excited via an AVB. Transverse mode intensity distribution of (b) and (c) . (d)–(g) Polarization distribution examination results of the generated mode; (h) Raman spectra of MG () molecules absorbed on the surface of the Ag-NPs-coated fiber probe internally excited with (black curve) and (red curve) modes, respectively. Integration time is 10 s, and excitation power is 3.5 mW. (i) Raman spectra of MG with different concentrations (, , and ) adsorbed on the surface of the Au-NPs-coated fiber probe excited via mode and Raman spectrum of MG solution adsorbed on the surface of Au-NPs-coated fiber probe (pink curve) excited via mode. The integration time is 10 s, and the excitation power is 3.5 mW.
After the generation of the mode in the FMF via the AIFG, an Ag-NPs-coated fiber probe, as shown in Fig. 3(b), is fabricated at the output terminal of the FMF. As a widely accepted target analyte, Raman spectra of MG with concentrations adsorbed on the surface of the Au-NPs-coated fiber probe are internally excited using and modes to reveal the electric field enhancement characteristic. As shown in Fig. 4(h), the red and black curves are the Raman spectra excited using and modes. The excitation power is 3.5 mW measured from the output terminal before the fiber-tapering process, and the integration time is 10 s. Note that Raman spectrum intensity under excitation is approximately eight times stronger than that of excitation, revealing that exciting the Ag-NPs-coated fiber probe via can obtain a larger SERS active surface than that of mode excitation, and this experiment result verifies the rationality of the theoretical analysis, as shown in Fig. 2. The magnification () is better than that of other AVB excited Raman detection systems () [35].
Furthermore, to reveal the SERS activity of the fabricated Au-NPs-coated fiber probe, the Raman spectra of MG with lower concentrations (, , and ) adsorbed on three Ag-NPs-coated fiber probes are, respectively, measured, and the corresponding Raman spectra of MG with different concentrations are shown in Fig. 4(i). Note that all the characteristic peaks of MG can be distinguished clearly even with a concentration down to under mode excitation, revealing the high SERS activity of the fabricated Ag-NPs-coated fiber probe excited by the mode. For comparison, the Raman spectrum of MG solution adsorbed on the surface of the Ag-NPs-coated fiber probe is also measured under excitation, as shown in the pink curve in Fig. 4(i). Note that no SERS signal is detected under mode excitation.
The time stability of the Ag-NPs-coated fiber probe is also examined. As shown in Fig. 5(a), the red and black curves are the Raman spectra excited using and modes. After that, an Ag-NPs-coated fiber probe is stored in a lab environment for 3 h; note that the Raman spectrum intensity under mode excitation is still approximately eight times stronger than that of mode excitation. Figure 5(b) shows the Raman spectra as a function of storage time, recorded at 10 min intervals for 60 min. Note that all characteristic peaks can be distinguished clearly after preservation for 3 h, even though there exists slight intensity fluctuation. The time variation of the intensity of the band is shown in Fig. 5(c). Note that the SERS signal is quite stable for 60 min. The standard deviation (SD) and the corresponding relative SD (RSD) are calculated to be 182.06 and 5.8%, respectively, revealing excellent time stability.
Figure 5.(a) Raman spectra of the MG solution () absorbed on the surface of the silver-coated fiber tip and internally excited via mode (black curve) and mode (red curve) after the probe being stored in a lab environment for 3 h. The integration time is 10 s. The excitation power is 3.5 mW. (b) Raman spectra as a function of storage time, recorded at 10 min intervals for 60 min, for the sample stored in a lab environment for 3 h before measuring the Raman spectra under mode excitation. The integration time is 5 s. The excitation power is 3.5 mW. (c) Time variation of intensity of the band as shown in (b).
Moreover, three Ag-NPs-coated fiber probes were fabricated to examine the repeatability of the Ag-NPs-coated fiber probe. Raman spectra of MG () absorbed on the surface of three Ag-NPs-coated fiber probes excited with and modes are, respectively, shown in Figs. 6(a)–6(c). The variation of the magnification calculated with the intensity of the band of the three SERS fiber probes, respectively, excited using and modes is shown in Fig. 6(c). The SD and the corresponding RSD from the three SERS fiber probes are calculated to be 0.32 and 4.4% [22], revealing excellent repeatability.
Figure 6.(a)–(c) Raman spectra of MG () detected with three different Au-NPs-coated fiber probes and internally excited via and modes, respectively. The integration time is 10 s. The excitation power is 3.5 mW. (d) Histogram of the magnification calculated with the intensity of the band of the three SERS fiber probes excited using and modes.
4. CONCLUSION
In conclusion, a method was presented for highly sensitive SERS detection based on a plasmonic tip internally excited via an AVB. Theoretical analysis shows that the Ag-NPs-coated fiber probe internally excited via the mode can provide a larger SERS active surface than that of mode excitation. The experimental result shows that the intensity of the Raman spectrum of MG by internally exciting the Ag-NPs-coated fiber tip via an AVB is about eight times as strong as that of LPB excitation, thereby verifying the rationality of the theoretical analysis. The detection sensitivity under AVB excitation can reach , which cannot be achieved by LPB excitation. The time stability and reliability are determined to be excellent. This work gives an effective and reliable way to further improve SERS fiber probe technology.
References
[1] S. Schlücker. Surface-enhanced Raman spectroscopy: concepts and chemical applications. Angew. Chem., 53, 4756-4795(2014).
[2] F. Y. Yang, H. R. Zhang, H. M. Feng, J. J. Dong, C. Wang, Q. Liu. Bionic SERS chip with super-hydrophobic and plasmonic micro/nano dual structure. Photon. Res., 6, 77-83(2018).
[3] S. Y. Ding, J. Yi, J. F. Li, B. Ren, D. Y. Wu, R. Panneerselvam, Z. Q. Tian. Nanostructure-based plasmon-enhanced Raman spectroscopy for surface analysis of materials. Nat. Rev. Mater., 1, 16021(2016).
[4] H. K. Chen, X. J. Wu, Y. Q. Zhang, Y. Yang, C. J. Min, S. W. Zhu, X. C. Yuan, Q. L. Bao, J. Bu. Wide-field in situ multiplexed Raman imaging with superresolution. Photon. Res., 6, 530-534(2018).
[5] B. Sharma, R. R. Frontiera, A. I. Henry, E. Ringe, R. P. V. Duyne. SERS: materials, applications, and the future. Mater. Today, 15, 16-25(2012).
[6] F. F. Lu, W. D. Zhang, L. G. Huang, S. H. Liang, D. Mao, F. Gao, T. Mei, J. L. Zhao. Mode evolution and nanofocusing of grating-coupled surface plasmon polaritons on metallic tip. Opto-Electron. Adv., 1, 180010(2018).
[7] V. Shalaev, A. Sarychev. Nonlinear optics of random metal-dielectric films. Phys. Rev. B, 57, 13265-13288(1998).
[8] A. X. Wang, X. M. Kong. Review of recent progress of plasmonic materials and nano-structures for surface-enhanced Raman scattering. Materials, 8, 3024-3052(2015).
[9] S. Y. Ding, E. M. You, Z. Q. Tian, M. Moskovits. Electromagnetic theories of surface-enhanced Raman spectroscopy. Chem. Soc. Rev., 46, 4042-4076(2017).
[10] H. L. Wang, Y. Y. Wang, Y. Wang, W. Q. Xu, S. P. Xu. Modulation of hot regions in waveguide-based evanescent-field-coupled localized surface plasmons for plasmon-enhanced spectroscopy. Photon. Res., 5, 527-535(2017).
[11] S. M. Nie, S. R. Emory. Probing single molecules and single nanoparticles by surface-enhanced Raman scattering. Science, 275, 1102-1106(1997).
[12] C. Chen, Y. Li, S. Kerman, P. Neutens, K. Willems, S. Cornelissen, L. Lagae, T. Stakenborg, P. V. Dorpe. High spatial resolution nanoslit SERS for single-molecule nucleobase sensing. Nat. Commun., 9, 1733(2018).
[13] P. Mao, C. X. Liu, G. Favraud, Q. Chen, M. Han, A. Fratalocchi, S. Zhang. Broadband single molecule SERS detection designed by warped optical spaces. Nat. Commun., 9, 5428(2018).
[14] J. J. Wang, M. M. Hassan, W. Ahmad, T. H. Jiao, Y. Xu, H. H. Li, Q. Ouyang, Z. M. Guo, Q. S. Chen. A highly structured hollow ZnO@Ag nanosphere SERS substrate for sensing traces of nitrate and nitrite species in pickled food. Sens. Actuators B, 285, 302-309(2019).
[15] C. L. Fernandez, L. Polavarapu, D. M. Solis, J. M. Taboada, F. Obelleiro, R. C. Contreras, I. S. Pastoriza, J. J. Perez. Gold nanorod-pNIPAM hybrids with reversible plasmon coupling: synthesis, modeling, and SERS properties. ACS Appl. Mater. Inter., 7, 12530-12538(2015).
[16] H. Wang, K. B. Li, C. Xu, S. C. Xu, G. H. Li. Large-scale solvothermal synthesis of Ag nanocubes with high SERS activity. J. Alloy. Compd., 772, 150-156(2019).
[17] K. Kim, J. W. Lee, K. S. Shin. Polyethylenimine-capped Ag nanoparticle film as a platform for detecting charged dye molecules by surface-enhanced Raman scattering and metal-enhanced fluorescence. ACS Appl. Mater. Interface, 4, 5498-5504(2012).
[18] C. Cheng, J. Li, H. X. Lei, B. J. Li. Surface enhanced Raman scattering of gold nanoparticles aggregated by a gold-nanofilm-coated nanofiber. Photon. Res., 6, 357-362(2018).
[19] H. Y. Xu, C. X. Kan, C. Z. Miao, C. S. Wang, J. J. Wei, Y. Ni, B. B. Lu, D. N. Shi. Synthesis of high-purity silver nanorods with tunable plasmonic properties and sensor behavior. Photon. Res., 5, 27-32(2017).
[20] S. Juneja, M. S. Shishodia. Surface plasmon amplification in refractory transition metal nitrides based nanoparticle dimers. Opt. Commun., 433, 89-96(2019).
[21] S. Li, L. G. Xu, W. Ma, H. Kuang, L. B. Wang, C. L. Xu. Triple Raman label-encoded gold nanoparticle trimers for simultaneous heavy metal ion detection. Small, 11, 3435-3439(2015).
[22] W. D. Zhang, C. Li, K. Gao, F. F. Lu, M. Liu, X. Li, L. Zhang, D. Mao, F. Gao, L. G. Huang, T. Mei, J. L. Zhao. Surface-enhanced Raman spectroscopy with Au-nanoparticles substrates fabricated by using femtosecond pulse. Nanotechnology, 29, 205301(2018).
[23] R. Chikkaraddy, G. A. E. Vandenbosch, X. Zheng, F. Benz, L. J. Brooks, B. D. Nijs, C. Carnegie, M. E. Kleemann, J. Mertens. How ultranarrow gap symmetries control plasmonic nanocavity modes: from cubes to spheres in the nanoparticle-on-mirror. ACS Photon., 4, 469-475(2017).
[24] Z. L. Huang, X. Lei, Y. Liu, Z. W. Wang, X. J. Wang, Z. M. Wang, Q. H. Mao, G. W. Meng. Tapered optical fiber probe assembled with plasmonic nanostructures for surface-enhanced Raman scattering application. ACS Appl. Mater. Interface, 7, 17247-17254(2015).
[25] T. Hutter, S. R. Elliott, S. Mahajan. Optical fibre-tip probes for SERS: numerical study for design considerations. Opt. Express, 26, 15539-15550(2018).
[26] J. Zhang, S. M. Chen, T. C. Gong, X. L. Zhang, Y. Zhu. Tapered fiber probe modified by Ag nanoparticles for SERS detection. Plasmonics, 11, 743-751(2016).
[27] J. Cao, D. Zhao, Q. H. Mao. A highly reproducible and sensitive fiber SERS probe fabricated by direct synthesis of closely packed Ag-NPs on the silanized fiber taper. Analyst, 142, 596-602(2017).
[28] C. Wang, L. H. Zeng, Z. Lia, D. L. Li. Review of optical fibre probes for enhanced Raman sensing. J. Raman Spectrosc., 48, 1040-1055(2017).
[29] H. Tanya, E. R. Stephen, M. Sumeet. Optical fibre-tip probes for SERS: numerical study for design considerations. Opt. Express, 26, 15539-15550(2018).
[30] H. X. Xu, M. Kall. Polarization-dependent surface-enhanced Raman spectroscopy of isolated silver nanoaggregates. Chem. Phys. Chem., 4, 1001-1005(2003).
[31] T. Itoh, K. Hashimoto, Y. Ozaki. Polarization dependences of surface plasmon bands and surface-enhanced Raman bands of single Ag nanoparticles. Appl. Phys. Lett., 83, 2274-2276(2003).
[32] A. P. Yang, L. P. Du, X. J. Dou, F. F. Meng, C. L. Zhang, C. J. Min, J. Lin, X. C. Yuan. Sensitive gap-enhanced Raman spectroscopy with a perfect radially polarized beam. Plasmonics, 13, 991-996(2018).
[33] F. F. Lu, T. X. Huang, L. Han, H. S. Su, H. Wang, M. Liu, W. D. Zhang, X. Wang, T. Mei. Tip-enhanced Raman spectroscopy with high-order fiber vector beam excitation. Sensors, 18, 3841(2018).
[34] Q. W. Zhan. Cylindrical vector beams: from mathematical concepts to applications. Adv. Opt. Photon., 1, 1-57(2009).
[35] Z. D. Schultz, S. J. Stranick, I. W. Levin. Advantages and artifacts of higher order modes in nanoparticle-enhanced backscattering Raman imaging. Anal. Chem., 81, 9657-9663(2009).
[36] Y. Saito, P. Verma. Polarization-controlled Raman microscopy and nanoscopy. J. Phys. Chem. Lett., 3, 1295-1300(2012).
[37] H. Chen, F. Tian, J. M. Chi, J. Kanka, H. Du. Advantage of multi-mode sapphire optical fiber for evanescent-field SERS sensing. Opt. Lett., 39, 5822-5825(2014).
[38] A. W. Snyder, J. Love. Optical Waveguide Theory, 252-260(2012).
[39] X. Q. Wu, L. M. Tong. Optical microfibers and nanofibers. Nanophotonics, 2, 407-428(2013).
[40] T. Liu, X. S. Xiao, C. X. Yang. Surfactantless photochemical deposition of gold nanoparticles optical on an optical fiber core for surface-enhanced Raman scattering. Langmuir, 27, 4623-4626(2011).
[41] W. D. Zhang, L. G. Huang, K. Y. Wei, P. Li, B. Q. Jiang, D. Mao, F. Gao, T. Mei, G. Q. Zhang, J. L. Zhao. Cylindrical vector beam generation in fiber with mode selectivity and wavelength tunability over broadband by acoustic flexural wave. Opt. Express, 24, 10376-10384(2016).
[42] K. Y. Wei, W. D. Zhang, L. G. Huang, D. Mao, F. Gao, T. Mei, J. L. Zhao. Generation of cylindrical vector beams and optical vortex by two acoustically induced fiber gratings with orthogonal vibration directions. Opt. Express, 25, 2733-2741(2017).
[43] X. C. Zhang, W. D. Zhang, C. Li, D. Mao, F. Gao, L. G. Huang, D. X. Yang, T. Mei, J. L. Zhao. All-fiber cylindrical vector beams laser based on an acoustically-induced fiber grating. J. Opt., 20, 075608(2018).


