• Laser & Optoelectronics Progress
  • Vol. 57, Issue 20, 201016 (2020)
Shuai Tian1, Yafei Ren1, Xinye Shao1、2, and Jianlong Shao1、*
Author Affiliations
  • 1Faculty of Information Engineering and Automation, Kunming University of Science and Technology, Kunming, Yunnan 650500, China
  • 2College of Engineering & Science, Florida Institute of Technology, Melbourne, FL 32901, U.S.A.;
  • show less
    DOI: 10.3788/LOP57.201016 Cite this Article Set citation alerts
    Shuai Tian, Yafei Ren, Xinye Shao, Jianlong Shao. Multifocus Fusion Image Enhancement Based on Image Subtraction Angiography and NSML[J]. Laser & Optoelectronics Progress, 2020, 57(20): 201016 Copy Citation Text show less
    Schematic of principle of SNFS method
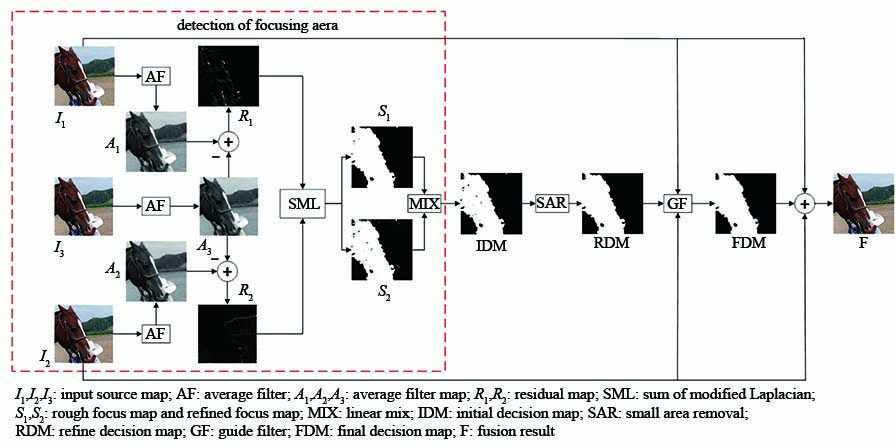
    Fig. 1. Schematic of principle of SNFS method
    Removal of detail processing results for different r values. (a) IDM; (b) 0.00001 pixel; (c) 0.0001 pixel; (d) 0.001 pixel; (e) 0.01 pixel; (f) 0.1 pixel
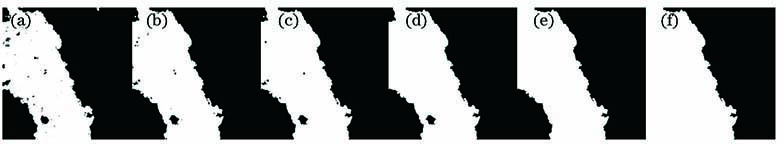
    Fig. 2. Removal of detail processing results for different r values. (a) IDM; (b) 0.00001 pixel; (c) 0.0001 pixel; (d) 0.001 pixel; (e) 0.01 pixel; (f) 0.1 pixel
    Partial public dataset image. (a) Grayscale images; (b) color images
    Fig. 3. Partial public dataset image. (a) Grayscale images; (b) color images
    Quantitative results of different parameters on fusion index. (a) r; (b) w; (c) ε
    Fig. 4. Quantitative results of different parameters on fusion index. (a) r; (b) w; (c) ε
    Decision graphs and fusion results obtained by different detection methods. (a)I1; (b) MWGF; (c) CNN; (d) Ma'; (e) GFDF
    Fig. 5. Decision graphs and fusion results obtained by different detection methods. (a)I1; (b) MWGF; (c) CNN; (d) Ma'; (e) GFDF
    Whitening afterimages obtained by different detection methods. (a) I1; (b) NSCT_SR; (c) ASR; (d) MGFF
    Fig. 6. Whitening afterimages obtained by different detection methods. (a) I1; (b) NSCT_SR; (c) ASR; (d) MGFF
    Adaptability analysis results of color images. (a) QMI; (b) QM; (c) QY; (d) QCB
    Fig. 7. Adaptability analysis results of color images. (a) QMI; (b) QM; (c) QY; (d) QCB
    Adaptability analysis results of grayscale images. (a) QMI; (b) QM; (c) QY; (d) QCB
    Fig. 8. Adaptability analysis results of grayscale images. (a) QMI; (b) QM; (c) QY; (d) QCB
    MethodQMIQMQYQCB
    MWGF0.98071.74850.95240.7741
    Proposed1.01321.79830.95320.7797
    NSCT_SR0.86301.42000.93480.7358
    Proposed1.01181.80620.95270.7813
    ASR0.87061.19070.92910.7237
    Proposed1.01171.77100.94350.7882
    CNN1.00631.74760.95260.7808
    Proposed1.01491.81130.95310.7813
    Ma'1.00911.77580.95320.7816
    Proposed1.01461.80910.95320.7812
    MGFF0.75580.62270.87460.6668
    Proposed1.00831.77820.95110.7793
    GFDF1.01081.79530.95340.7823
    Proposed1.01421.81420.95300.7815
    Table 1. Comprehensive evaluation results of 13 sets of color images
    MethodQMIQMQYQCB
    MWGF1.03021.40840.87570.7333
    Proposed1.04701.42740.87930.7375
    NSCT_SR0.94831.21400.85240.7035
    Proposed1.04531.42620.88010.7371
    ASR0.95671.05460.85400.6717
    Proposed1.04471.42580.87670.7340
    CNN1.12431.74730.91520.7685
    Proposed1.04571.43020.87920.7380
    Ma'1.03541.38700.87450.7315
    Proposed1.04401.43200.87850.7353
    MGFF0.80900.59880.77160.6188
    Proposed1.03751.39720.87630.7310
    GFDF1.04081.42030.87820.7361
    Proposed1.04461.43040.87860.7371
    Table 2. Comprehensive evaluation results of 11 sets of grayscale images
    ImageMWGFNSCT_SRMa'CNNMGFFGFDFProposed
    Grayscale18.39159.484.89155.131.000.660.40
    Color15.62166.143.60133.471.960.520.37
    Table 3. Average time calculated by different methods unit: s
    Shuai Tian, Yafei Ren, Xinye Shao, Jianlong Shao. Multifocus Fusion Image Enhancement Based on Image Subtraction Angiography and NSML[J]. Laser & Optoelectronics Progress, 2020, 57(20): 201016
    Download Citation