Abstract
We describe the design and capabilities of the x-ray excited optical luminescence (XEOL) technique at the scanning transmission x-ray microscopy beamline (BL08U1A) of the Shanghai Synchrotron Radiation Facility. The detection system is a functional expanding of the original end station, making full use of its precision positioning stages. The simultaneous collection of XEOL and total electron yield spectra is realized using homemade software when the excitation energy is scanned. The setup is validated by the 2D near-edge x-ray absorption spectroscopy (NEXAFS) XEOL mapping across the O K-edge of a nanostructured ZnO sample. The ability to detect the signal of very weak light-emitting material is verified by using nanopowder.The Shanghai Synchrotron Radiation Facility (SSRF) is a third-generation synchrotron radiation light source in China and operates at an electron energy of 3.5 GeV and with a beam current of 240 mA[1,2]. The soft x-ray beamline (BL08U1A) at the SSRF provides intense, pulsed, tunable radiation in the range of 250–2000 eV[3]. This energy range covers the so-called “water window”, offering opportunities to look at the contributions from those low atomic number elements, such as carbon, nitrogen, and oxygen. Most importantly, at these energies the x-ray attenuation length is sufficiently short to allow for the probing of surface, interfacial, and bulk regions of the sample. It can be used to measure near-edge x-ray absorption fine structure spectroscopy (NEXAFS), and the 2D and 3D scanning transmission image. Currently, a NEXAFS spectrum is recorded in two modes in the BL08U1A beamline, transmission and total electron yield (TEY) measurements, respectively. The TEY mode is the simplest one, which is detected by collecting the drain current from the sample when the excitation energy is scanned. It is, particularly, a surface analytical method (probing depth about 5 nm)[4].
X-ray excited optical luminescence (XEOL), an x-ray photon in, optical photon out technique, is used to monitor the optical luminescence (UV-visible-NIR) from a light-emitting material excited at the desired excitation energy[5]. XEOL with synchrotron radiation has the advantage of being element, chemical, and excitation-channel specific, which is achieved by tuning the photon energy to a particular absorption edge of an element, thereby exciting preferentially those sites responsible for the optical emission[6]. Combined with the TEY measurement, it provides a better understanding of the interplay and role of each element in the light-emitting material[7]. Thus, a 2D NEXAFS-XEOL intensity map is widely used to study the nature of the bandgap and defect luminescence from nanostructures and identify the origin of luminescence[8]. Recently, Rosenberg et al. utilized the limited penetration depth of soft x-rays to study the native defect distribution in nanomaterials by obtaining optical luminescence spectra as a function of the angle between the sample and incident x-ray[9,10]. So far, several XEOL detector systems were built in different synchrotron radiation facilities, e.g., Advanced Photon Source, Canadian Light Source, and Diamond Light Source and have eventually become important tools for scientific research.
In this Letter, we will describe the experimental setup for this technique built at the BL08U1A beamline of the SSRF. Based on this experimental platform, 2D NEXAFS-XEOL intensity maps as a function of the luminescence wavelength and x-ray excitation energy can be produced. Simultaneous collection of an XEOL spectrum at every value of the excitation energy during the TEY scan is realized by our homemade software.
Sign up for Chinese Optics Letters TOC. Get the latest issue of Chinese Optics Letters delivered right to you!Sign up now
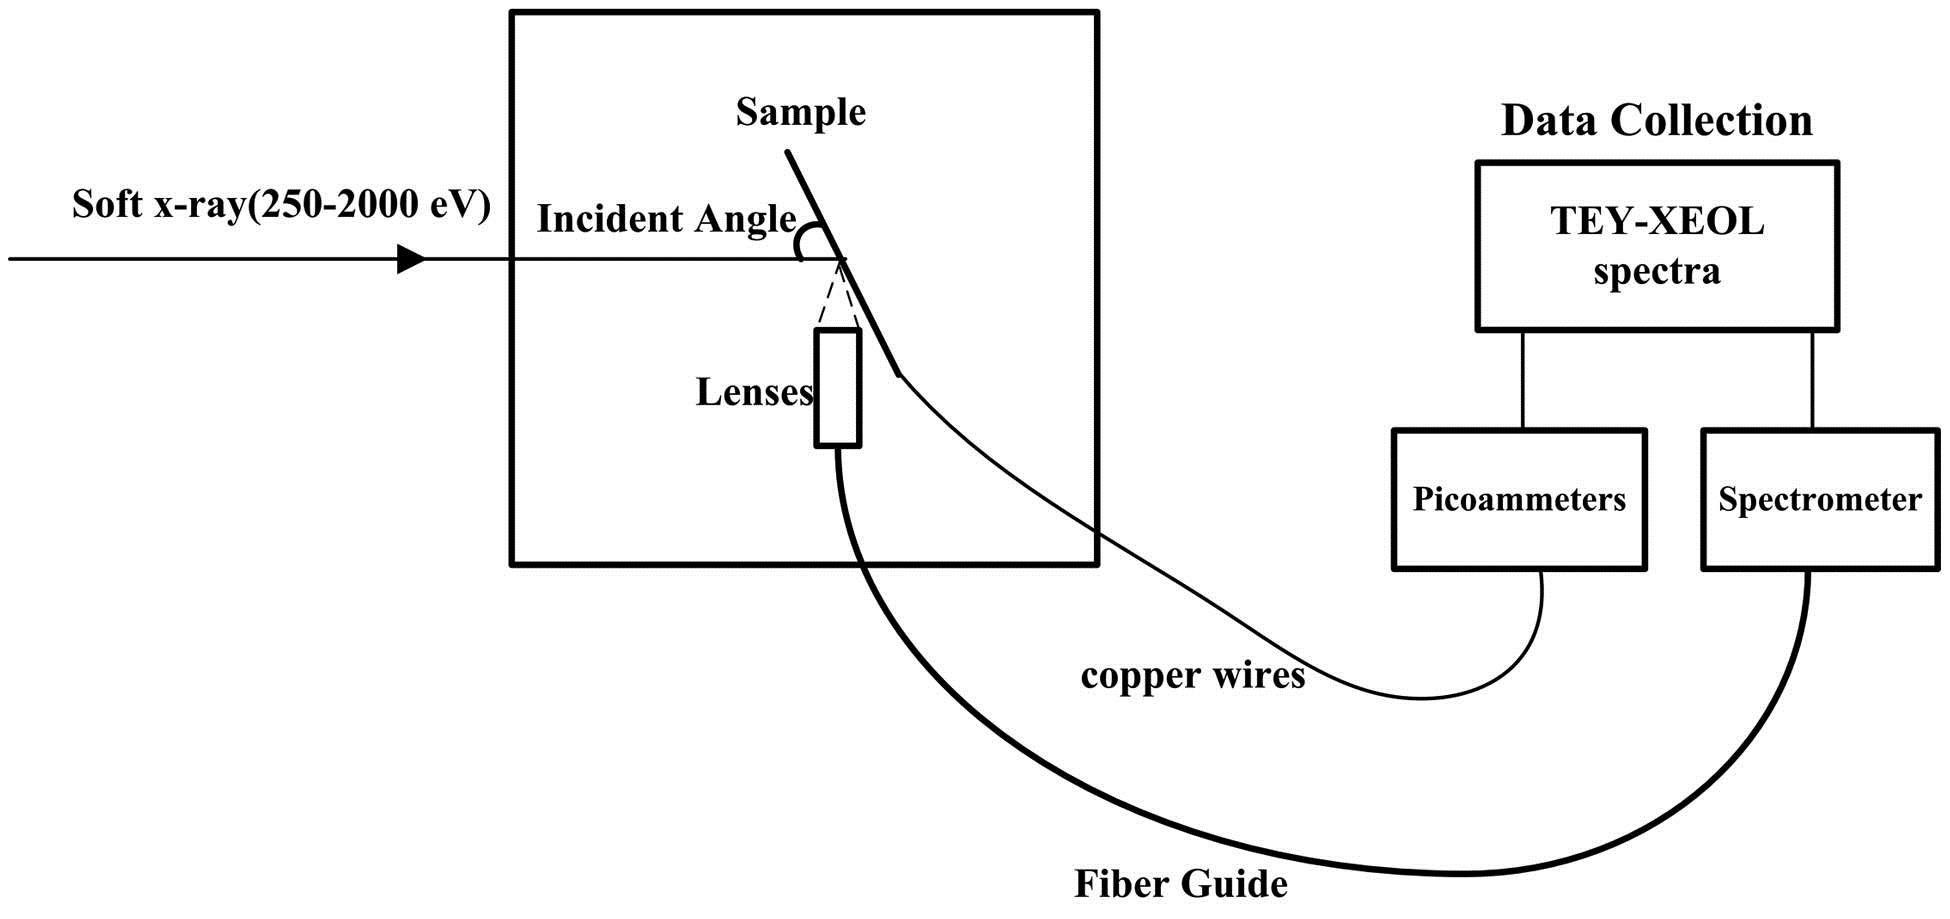
In our experimental setup, the monochromatized x-ray beam illuminates the sample with a specific incident angle, such as 45°, the light emitted by the sample is collected by a lens mounted at the end of an optical fiber, and then transferred to the spectrometer (QE65Pro, Ocean Optics, Inc., FL, USA) as shown in Figs. 1 and 2. The spectrometer we used houses a back-thinned, 2D charge-coupled device (CCD) that is sensitive to the light in a wavelength region from 200 to 950 nm and has replaceable slits, such as 50, 100, and 200 μm, with different wavelength resolution, and a composite grating HC1 with a bandwidth of 725 nm, just enough for our synchrotron radiation application purpose. In order to improve the positioning accuracy, the optical fiber and lens are docked to the original motorized detector, as shown in Fig. 2, to achieve a positioning accuracy of . Combining the commercial software driver package with the existing TEY data collection program, we developed homemade software to simultaneously trigger the spectrometer to collect a XEOL spectrum and the picoammeter to read out the TEY signal every time the excitation energy is tuned across the absorption edge of an element of interest within the material being studied. It ensures the accurate time correlation between the two signals and simplifies the data post-processing. All spectra are normalized to the incident photon flux, which can be monitored with an Au mesh or gold-coated silicon wafer.

Figure 1.Schematic diagram of the NEXAFS-XEOL detection system.
Figure 2.Picture of the NEXAFS-XEOL setup in the experimental chamber.
The NEXAFS-XEOL detection system was tested by using a nanostructured ZnO sample. Figure 3(a) shows a 2D NEXAFS-XEOL intensity map taken across the O K-edge of ZnO. The color represents the intensity of the XEOL. By taking vertical slices from Fig. 3(a), the XEOL spectra at selected excitation energies can be obtained, as shown in Fig. 3(b). It exhibits a weak near band gap emission peak at 380 nm and a broad defect emission peak at 531.3 nm. By taking horizontal slices from Fig. 3(a), the wavelength selected (531.3 and 380 nm) and zero-order PLY spectra can be gotten, as shown in Fig. 3(c). The PLY spectrum, marked as “PLY 380 nm,” is integrated between 377 and 383 nm due to very weak luminescence. The TEY spectrum is shown for comparison. The zero-order PLY is the same as that taken at 531.3 nm. Both PLY spectra are similar to the TEY but exhibit a decrease of the intensity at 539.4 eV relative to that at 535.8 eV. These results agree well with the literature report and confirm the availability of the XEOL detection system built at the BL08U1A beamline of the SSRF.
Figure 3.(a) 2D NEXAFS-XEOL mapping across the O K-edge shown with the corresponding TEY spectrum, (b) XEOL spectra taken across the O K-edge from Fig. 3(a) , and (c) the PLY spectra recorded at two wavelengths, 380 nm (in red) and 531.3 nm (in blue), and the zero order PLY spectrum (in green) of a nanostructured ZnO sample, compared with the TEY spectrum (in black).
To examine if the flux at the beamline station is suitable for the investigation of the optical properties of very weak light-emitting materials, the XEOL signals of 15-nm anatase nanoparticles are collected at the excitation energies across the O K-edge and Ti -edge. is one of the most investigated compounds in material science, and is well known as a semiconductor with a bandgap energy of . Compared with the ZnO sample, anatase nanopowder shows a very weak luminescence at room temperature[11,12]. In our experiment, a spectrum with a good signal-to-noise ratio takes 5 min, so instead of a full energy range scan, a series of spectra at selected energies is collected. Figure 4(a) shows the XEOL spectra across the O K-edge dominated by a visible luminescence band centered at about 537 nm, which is in agreement with previous observation. An interesting behavior can be observed from Fig. 4(b). The total PLY spectrum is similar to that of TEY, but shows a partial inversion below 534 eV across the O K-edge. The XEOL spectra across the Ti -edge are shown in Fig. 5(a). Their line shapes are similar and the peak position is the same as that for the O K-edge. From Fig. 5(b), a total inversion at the Ti edge is observed in the PLY spectrum.
Figure 4.Luminescence of anatase nanopowder across the O K-edge: (a) the XEOL spectra under selected excitation energies and (b) the PLY (zero-order) spectrum compared with the TEY spectrum.
Figure 5.Luminescence of anatase nanopwder across the Ti -edge: (a) the XEOL spectra under selected excitation energies and (b) the PLY (zero-order) spectrum in comparison with the TEY spectrum.
In conclusion, we demonstrate the design and experimental testing of our NEXAFS-XEOL detection system at the soft x-ray beamline of the SSRF. The simultaneous collection of the XEOL and TEY signals is realized. The application of this technique to the study of nanopowder has shown that it is possible to track the optical luminescence behavior of very weak light-emitting materials based on our system.
References
[1] J. H. He, Z. T. Zhao. Natl. Sci. Rev., 1, 171(2014).
[2] D. Cyranoski. Nature, 459, 16(2009).
[3] C. F. Xue, Y. Wang, Z. Guo, Y. Q. Wu, X. J. Zhen, M. Chen, J. H. Chen, S. Xue, Z. Q. Peng, Q. P. Lu, R. Z. Tai. Rev. Sci. Instrum., 81, 103502(2010).
[4] Y. Takahashi, V. K. Verma, G. Shibata, T. Harano, K. Ishigami, K. Yoshimatsu, T. Kadono, A. Fujimori, A. Tanaka, F. H. Chang, H. J. Lin, D. J. Huang, C. T. Chen, B. Pal, D. D. Sarma. Europhys. Lett., 108, 27003(2014).
[5] T. K. Sham. Adv. Mater., 26, 7896(2014).
[6] T. K. Sham, R. A. Rosenberg. Chem. Phys. Chem., 8, 2557(2007).
[7] M. J. Ward, J. G. Smith, T. Z. Regier, T. K. Sham. J. Phys. Conf. Ser., 425, 132009(2013).
[8] R. A. Rosenberg, G. K. Shenoy, M. F. Chisholm, L. C. Tien, D. Norton, S. Pearton. Nano. Lett., 7, 1521(2007).
[9] R. A. Rosenberg, M. Abu Haija, K. Vijayalakshmi, J. Zhou, S. Xu, Z. L. Wang. Appl. Phys. Lett., 95, 243101(2009).
[10] R. A. Rosenberg, Y. Choi, K. Vijayalakshmi, M. Kareev, J. Tchakhalian, S. Balaz, L. J. Brillson. Appl. Phys. Lett., 102, 192910(2013).
[11] L. J. Liu, J. Chan, T. K. Sham. J. Phys. Chem. C, 114, 21353(2010).
[12] X. L. Wang, Z. C. Feng, J. Y. Shi, G. Q. Jia, S. Shen, J. Zhou, C. Li. Phys. Chem. Chem. Phys., 12, 7083(2010).