• Opto-Electronic Engineering
  • Vol. 49, Issue 9, 220007 (2022)
Tao Li, Wei Jin*, Randi Fu, Gang Li, and Caoqian Yin
Author Affiliations
  • Faculty of Electrical Engineering and Computer Science, Ningbo University, Ningbo, Zhejiang 315211, China
  • show less
    DOI: 10.12086/oee.2022.220007 Cite this Article
    Tao Li, Wei Jin, Randi Fu, Gang Li, Caoqian Yin. Nighttime sea fog recognition based on remote sensing satellite and deep neural decision tree[J]. Opto-Electronic Engineering, 2022, 49(9): 220007 Copy Citation Text show less
    Overall algorithm flow chart
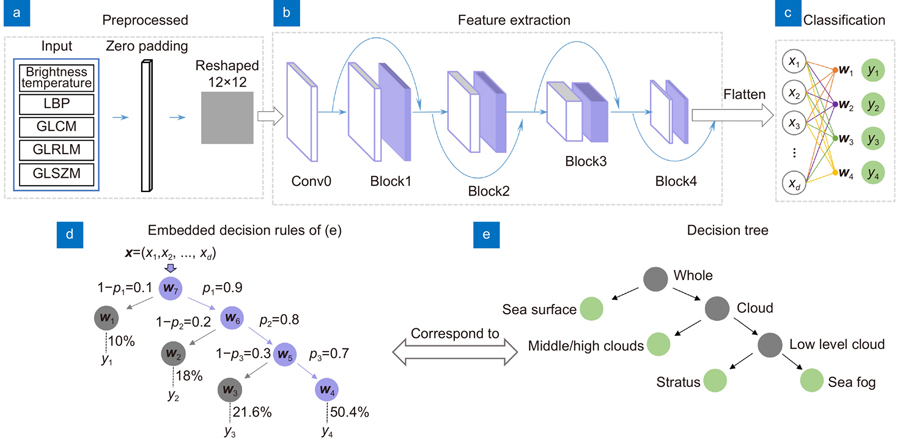
    Fig. 1. Overall algorithm flow chart
    An example of the model inference process
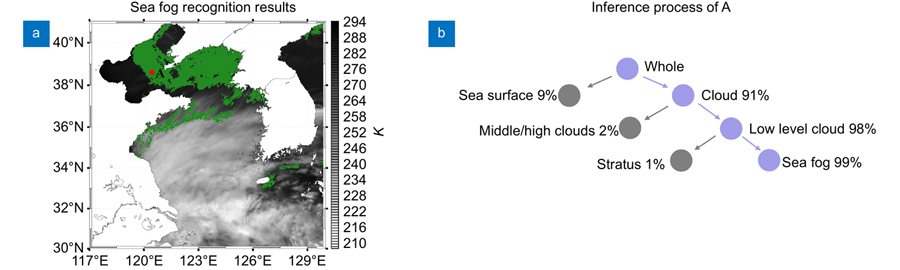
    Fig. 2. An example of the model inference process
    Sea fog identification result at UTC 18:20 on June 5, 2020 in the Yellow Sea and Bohai Sea
    Fig. 3. Sea fog identification result at UTC 18:20 on June 5, 2020 in the Yellow Sea and Bohai Sea
    The monitoring results of sea fog in the Yellow Sea and Bohai Sea from 15:00 to 20:00 UTC on June 5, 2020
    Fig. 4. The monitoring results of sea fog in the Yellow Sea and Bohai Sea from 15:00 to 20:00 UTC on June 5, 2020
    MethodMiddle/high cloudsStratusSea fogSea surfaceAverage
    POD/(%)89.3076.7182.1292.1585.07
    Three-groupsFAR/(%)11.0720.3721.137.4215.00
    CSI/(%)80.3664.1367.3185.8174.40
    POD/(%)89.0980.8786.4792.8487.32
    Four- groupsFAR/(%)7.0618.6419.147.9013.19
    CSI/(%)83.4468.2371.7885.9977.36
    POD/(%)90.4078.5982.0090.6585.41
    Five- groupsFAR/(%)11.0719.8219.247.5414.42
    CSI/(%)81.2565.8168.6084.4175.02
    POD/(%)91.9977.6080.2491.3485.29
    Six- groupsFAR/(%)11.6720.4317.837.0514.24
    CSI/(%)82.0264.7168.3485.4275.12
    Table 1. Experimental results of different network layers
    MethodMiddle/high cloudsStratusSea fogSea surfaceAverage
    POD/(%)87.3676.1181.7688.4583.42
    CNN_1DFAR/(%)11.6025.0723.794.8416.33
    CSI/(%)78.3860.6665.1484.6472.20
    POD/(%)89.0980.8786.4792.8487.32
    CNN_2DFAR/(%)7.0618.6419.147.9013.19
    CSI/(%)83.4468.2371.7885.9977.36
    Table 2. Comparison of results of different convolution networks
    MethodMiddle/high cloudsStratusSea fogSea surfaceAverage
    POD/(%)90.4067.5973.6593.3081.24
    ATFFAR/(%)11.5524.7221.5518.3019.03
    CSI/(%)80.8555.3161.2577.1768.65
    POD/(%)89.4481.9680.4789.4985.34
    ATLFAR/(%)8.8020.4021.927.5214.66
    CSI/(%)82.3467.7365.6483.4274.78
    POD/(%)89.0980.8786.4792.8487.32
    WOAFAR/(%)7.0618.6419.147.9013.19
    CSI/(%)83.4468.2371.7885.9977.36
    Table 3. Comparison of ablation results
    True labelMiddle/high cloudsStratusSea fogSea surface
    Middle/high clouds1290855815
    Stratus568169839
    Sea fog366473515
    Sea surface63818804
    Table 4. Confusion matrix of model
    MethodMiddle/high cloudsStratusSea fogSea surfaceAverage
    POD/(%)85.2881.7158.7891.7879.39
    SVMFAR/(%)19.1221.5631.029.0520.19
    CSI/(%)70.9766.7246.4984.1067.07
    POD/(%)81.4264.2262.7182.1072.61
    DTFAR/(%)19.4135.0136.8518.1827.36
    CSI/(%)68.0747.7245.9169.4357.78
    POD/(%)89.9981.1785.4193.7687.58
    ResNetFAR/(%)8.3717.9418.246.1312.67
    CSI/(%)83.1568.9471.7488.3678.05
    POD/(%)89.0980.8786.4792.8487.32
    OursFAR/(%)7.0618.6419.147.9013.19
    CSI/(%)83.4468.2371.7885.9977.36
    Table 5. Classification accuracy of different sea fog recognition methods
    Tao Li, Wei Jin, Randi Fu, Gang Li, Caoqian Yin. Nighttime sea fog recognition based on remote sensing satellite and deep neural decision tree[J]. Opto-Electronic Engineering, 2022, 49(9): 220007
    Download Citation