
Yinan Ji, Haifeng Li, Xu Liu. Image segmentation learning method for large field single lens computational imaging system[J]. Opto-Electronic Engineering, 2022, 49(5): 210371
- Opto-Electronic Engineering
- Vol. 49, Issue 5, 210371 (2022)
![Amplification of PSF with different fields of view[18]. (a) PSF within about 10 degrees; (b) PSF about 10 degrees to 30 degrees; (c) PSF about 30 degrees to 53 degrees](/richHtml/gdgc/2022/49/5/210371/2_210371-1.jpg)
Fig. 1. Amplification of PSF with different fields of view[18]. (a) PSF within about 10 degrees; (b) PSF about 10 degrees to 30 degrees; (c) PSF about 30 degrees to 53 degrees
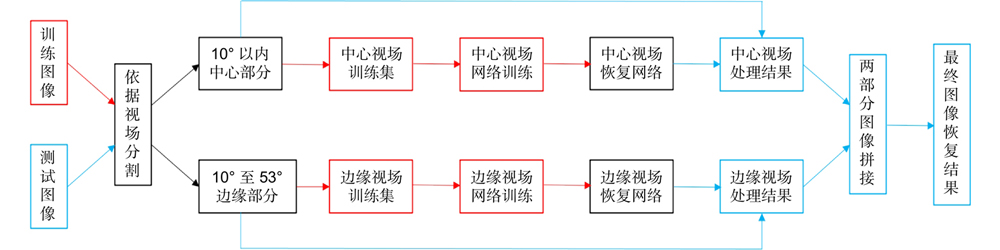
Fig. 2. The concrete implementation process of the new idea
(The red, blue and black boxes represent training, testing and the steps shared by them respectively, and the red,
blue and black arrows represent training, testing and the processes shared by them respectively)
Fig. 3. Overall hardware system (sensors in the red box)
Fig. 4. Image shooting and registration process
Fig. 5. Sample of center partial dataset (shot image on the left, original image on the right)
Fig. 6. Sample of edge partial dataset (shot image on the left, original image on the right). The reasons for leaving holes in the middle are detailed in the following article
Fig. 7. Sample of test set after restoration, with two details highlighted in red boxes are listed below each image. (a) Ground truth images; (b) Blurred images; (c) Results obtained by means of Ref.[18]; (d) Results of our method
Fig. 8. Sample of real pictures after restoration, with a detail selected in a red box is listed above or below each image. (a) Blurred images; (b) Results obtained by means of literature [18]; (c) Results of our method
|
Table 1. Comparison of PSNR evaluation results
|
Table 2. Comparison of SSIM evaluation results


Set citation alerts for the article
Please enter your email address

© Copyright 2018-2021 | Chinese Laser Press. All Rights Reserved 沪ICP备15018463号-20