• Spectroscopy and Spectral Analysis
  • Vol. 40, Issue 12, 3953 (2020)
Xian-qing WANG1、1、*, Tong WEI1、1, Yong YANG1、1, and Yan-guo SHI1、1
Author Affiliations
  • 1[in Chinese]
  • 11. College of Food Science, Heilongjiang Bayi Agricultural University, Daqing 163319, China
  • show less
    DOI: 10.3964/j.issn.1000-0593(2020)12-3953-10 Cite this Article
    Xian-qing WANG, Tong WEI, Yong YANG, Yan-guo SHI. Molecular Structure of Two Glutamate Decarboxylases From Mung Bean [Vigna Radiate (L.)] Analyzed by Spectroscopy[J]. Spectroscopy and Spectral Analysis, 2020, 40(12): 3953 Copy Citation Text show less
    Purification of mung bean’s GAD by DEAE-Sepharose FF chromatography (a) and Superdex 200 chromatography (b)
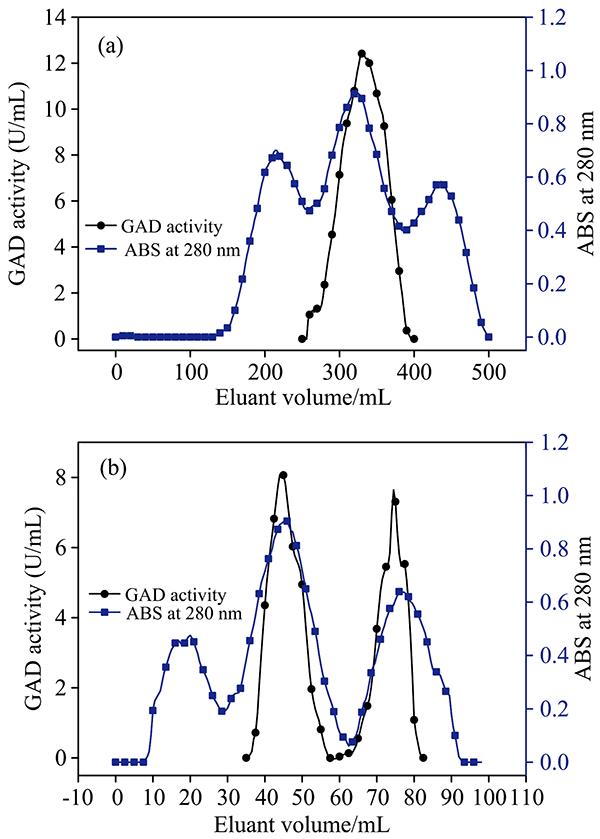
    Fig. 1. Purification of mung bean’s GAD by DEAE-Sepharose FF chromatography (a) and Superdex 200 chromatography (b)
    Purification of mung bean’s GAD by Superdex 200 chromatography(a): GAD1; (b): GAD2
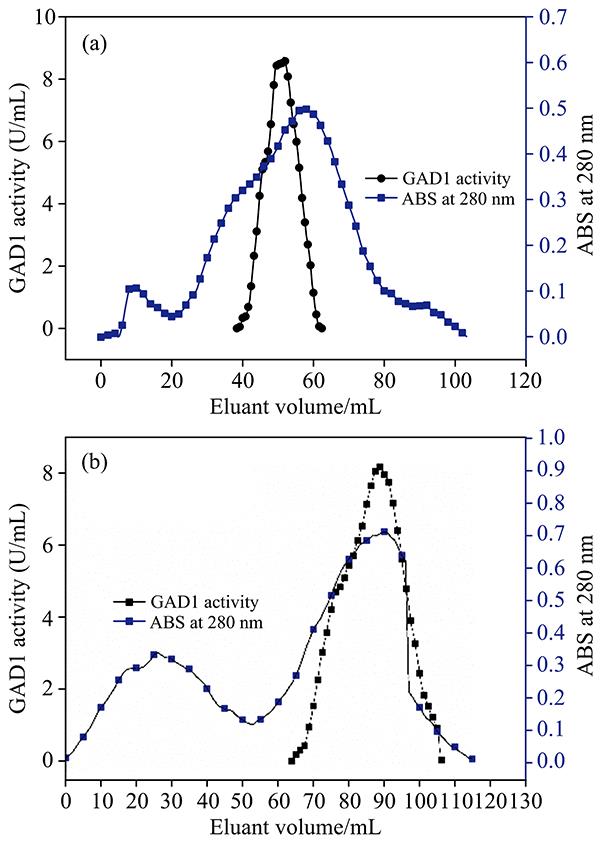
    Fig. 2. Purification of mung bean’s GAD by Superdex 200 chromatography
    (a): GAD1; (b): GAD2
    HPLC separation of GAD1 and GAD2 from Mung Bean
    Fig. 3. HPLC separation of GAD1 and GAD2 from Mung Bean
    Subunit composition of mung bean GAD
    Fig. 4. Subunit composition of mung bean GAD
    The optimum pH of pH stability of GAD activity(a): Optimum pH of GAD activity;(b): pH stability of GAD activity
    Fig. 5. The optimum pH of pH stability of GAD activity
    (a): Optimum pH of GAD activity;(b): pH stability of GAD activity
    The optimum temperature of temperature stability of GAD activity(a): The optimum temperature of GAD activity;(b): temperature stability of GAD activity
    Fig. 6. The optimum temperature of temperature stability of GAD activity
    (a): The optimum temperature of GAD activity;(b): temperature stability of GAD activity
    FT-IR spectrum of GAD1 and GAD2
    Fig. 7. FT-IR spectrum of GAD1 and GAD2
    Raman spectrum of GAD1 and GAD2
    Fig. 8. Raman spectrum of GAD1 and GAD2
    Fluorescence spectrum of GAD1 and GAD2
    Fig. 9. Fluorescence spectrum of GAD1 and GAD2
    ReagentRemained activity
    of GAD1/%
    Remained activity
    of GAD2/%
    Control100100
    KCl95.67±2.1298.36±1.45
    KI81.76±2.4590.35±2.27
    MgSO482.45±1.3798.87±1.98
    MgCl295.36±1.6198.72±1.49
    AgNO385.67±1.1976.52±1.23
    CaCl2117.82±0.86120.22±0.12
    CuCl2109.34±2.57115.41±0.12
    FeCl298.67±1.92130.98±3.22
    Tween80102.59±2.88104.51±2.08
    SDS53.62±1.9167.88±0.88
    Table 1. Effect of chemical reagents on GAD activity
    Content/%α-helixβ-sheetβ-turnunordered structure
    GAD135.35±0.0519.76±0.0224.65±0.0422.24±0.03
    GAD237.89±0.0224.88±0.0320.87±0.0416.36±0.01
    Table 2. Secondary structure of GAD1 and GAD2 determined by FT-IR
    Content/%α-helixβ-sheetβ-turnunordered structure
    GAD140.05±0.0715.16±0.0315.65±0.0430.04±0.02
    GAD247.93±0.0316.84±0.0110.83±0.0324.30±0.03
    Table 3. Secondary structure content of GAD1 and GAD2 determined by Raman
    SampleTrp (I760/I1 003 cm-1)Tyr doublet (I850/I830 cm-1)CH (I1 450/I1 003 cm-1)
    GAD10.93±0.01b0.99±0.01a1.31±0.01a
    GAD20.98±0.02a0.87±0.01b1.03±0.01b
    Table 4. Side chain group band intensity of GAD1 and GAD2
    Xian-qing WANG, Tong WEI, Yong YANG, Yan-guo SHI. Molecular Structure of Two Glutamate Decarboxylases From Mung Bean [Vigna Radiate (L.)] Analyzed by Spectroscopy[J]. Spectroscopy and Spectral Analysis, 2020, 40(12): 3953
    Download Citation