
Xian-qing WANG, Tong WEI, Yong YANG, Yan-guo SHI. Molecular Structure of Two Glutamate Decarboxylases From Mung Bean [Vigna Radiate (L.)] Analyzed by Spectroscopy[J]. Spectroscopy and Spectral Analysis, 2020, 40(12): 3953
- Spectroscopy and Spectral Analysis
- Vol. 40, Issue 12, 3953 (2020)
Abstract
Introduction
Glutamate decarboxylase (GAD) catalyzes the α-decarboxylation reaction of glutamate to produce γ-aminobutyric acid (GABA). GAD has been shown to play an important role in the regulation of brain excitability through the synthesis of GABA and it is considered a specific marker for GABAergic neurons and their processes[
Mung bean [Vigna radiate (L.)] has been eaten since ancient times. It has been traditionally grown in most parts of China and has been accepted as part of the local diet in soups and desserts[
1 Materials and methods
1.1 Materials
Mung beans were obtained from the local market within three months after harvest and were stored at room temperature during the studies. Analytical grade chemicals and reagents were purchased from Sigma Chemical Corp. (MO, USA).
1.2 Determination of GAD activity
The reaction mixture consisted of 200 μL of 50 mmol·L-1 sodium phosphate, pH 5.6, 100 mmol·L-1 L-glutamate, 0.2 mmol·L-1 Pyridoxal phosphate (PLP), and 100 μL of the enzyme. The reaction solution was incubated at 40 ℃ for 60 min, and then the reaction was terminated by the addition of 100 μL of 32% (W/V) trichloroacetic acid (TCA). The suspension was filtered through a 0.45 μm membrane filter (Whatman, USA). The filtrate was analyzed for GABA content using Agilent’s 1100 HPLC (Agilent Technologies, USA). One GAD activity unit was defined as the release of 1 μmol of GABA produced from L-glutamate per 30 min at 40 ℃. Specific activity was defined as GAD activity units per mg of the enzyme[
1.3 Preparation and purification of GAD
Two hundred grams of mung beans were homogenized at 10 000 r·min-1 for 15 min in 1 L of 50 mmol·L-1 sodium phosphate buffer, pH 5.6, containing 0.2 mmol·L-1 PLP, and 2 mmol·L-1 2-mercaptoethanol (ME), 2 mmol·L-1 Ethylenediaminetetraacetic acid (EDTA), and 1 mmol·L-1 Phenylmethanesulfonyl fluoride (PMSF). After homogenization, the protein extract was filtered through four layers of cheesecloth and centrifuged at 7 000 g for 20 min at 4 ℃. Solid ammonium sulfate was then added to this crude extract up to 30% saturation and centrifuged at 10 000 g for 20 min at 4 ℃. The supernatant was adjusted to 50% saturation by further addition of solid ammonium sulfate and centrifuged again at 10 000 g for 20 min at 4 ℃. The precipitate was dissolved in 100 mL of the standard buffer. The mixture was dialyzed three times against 2 L of the standard buffer. The supernatant of the dialysate was called the crude GAD and used for further purification. Protein concentrations in various preparations were assayed by Bradford’s method.
Crude GAD was first purified by a 2.5×25 cm DEAE-Sepharose FF ion exchange column which was eluted with a linear gradient of 0~1.4 mol·L-1 NaCl in the standard buffer. The enzyme activity peak was obtained for further purifying. The dialyzed enzyme purified by gel filtration chromatography with a 1.0×100 cm Superdex-200 column which was pre-equilibrated with the standard buffer. Two fractions with high GAD activities were collected again. Two GADs separated were loaded on affinity chromatography with Glu-Sepharose CL 4B column that eluted with 300 mL of a linear gradient of 0~0.5 mol·L-1 NaCl in the standard buffer[
1.4 Determination of subunit composition of GAD by SDS-PAGE profile
Sodium dodecyl sulfate-polyacrylamide gel electrophoresis (SDS-PAGE) was performed, according to Liu et al.[
1.5 Determination of molecular weight of GAD by analytical gel filtration
The purified GAD was loaded on a Sephacryl S-100 HR 16/60 column equilibrated with phosphate buffer (PB) containing 0.15 mol·L-1 NaCl and EDTA, and eluted with the same buffer at a flow rate of 0.5 mL·min-1. Amylase (200 kDa), alcohol dehydrogenase (150 kDa), bovine serum albumin (66 kDa), carbonic anhydrase (29 kDa), and cytochrome c (12.4 kDa) were used as molecular weight standards. All standards were purchased from Sigma-Aldrich (St. Louis, MO).
1.6 Effect of pH on GAD activity
The optimum pH for GAD activity was determined within a range of pH 3.5 to 8.5 in 0.5 mol·L-1 citrate or sodium phosphate buffer supplemented with 50 mmol·L-1 glutamate and 10 mmol·L-1 PLP at 37 ℃. The pH stability of the enzyme was determined by incubating it at each pH (4, 5, 6, 7, and 8) with 0.5 mol·L-1 citrate or sodium phosphate buffer for 1 h at 4 ℃, followed by residual activity measurement.
1.7 Effect of temperature on GAD activity
The optimum temperature for GAD activity was determined during a 30 min exposure to a temperature range of 20 to 60 ℃ in 0.5 mol·L-1 citrate buffer (pH 5.0) with 50 mmol·L-1 of glutamate and 10 mmol·L-1 of PLP. The thermal stability of the enzyme was determined by incubating the enzyme in a temperature range of 20 to 60 ℃ for 1 h at pH 5.0, and the residual activity of the enzyme was measured at 37 ℃.
1.8 Effect of various reagents on GAD activity
Fifty microliters (2 mmol·L-1) of either KCl, KI, MgSO4, MnSO4, Al2(SO4)3, AgNO3, Li2SO4, HgCl2, or CaCl2 were incubated with 50 μL of the enzyme (0.2 mg·mL-1) at 30 ℃ for 30 min. The remaining GAD activity was measured as described above.
1.9 Fourier transform infrared spectroscopy (FTIR) analysis
FTIR absorption spectra from 4 000 to 400 cm-1 were acquired in the transmission mode by a Nicolet Magna IR 550 FTIR spectrometer (Thermo Fisher Scientific Inc., Waltham, MA, USA) continuously purged with dry air and equipped with a liquid nitrogen cooling MCT detector. GAD samples were first freeze-dried and then produced by pressing in KBr windows (1.5 mg protein to 200 mg KBr) on a Carver press at 5~6 T pressure. Each spectrum was obtained by co-adding 256 interferograms at a spectral resolution of 2.0 cm-1. The decomposition of the amide Ⅰ band was performed in the region of 1 700~1 600 cm-1. The quantitative analysis of the secondary structural components of GAD was determined by a Peak fitting software according to the method of Wang’s[
1.10 Raman spectroscopic analysis
To perform a Raman experiment, 150 mg of GADs are considered. Raman spectra are recorded on a Perkin Elmer Raman Station 400F Dispersive Raman Spectrometer, that is equipped with a 785 nm diode laser, which is used as depending on the fluorescence contribution of the sample. The laser is focused on the samples, which are placed on microscope slides. Each spectrum is obtained under the following conditions: 80 mW of laser power; 4 scans; 60 s exposure time; 2 cm-1 resolution; and the range of Raman spectra is about 400~2 000 cm-1. Each sample is scanned at least thrice, and the Raman spectra for each sample are plotted by calculating the mean. Errors in band position are less than ± 3 cm-1.
1.11 Fluorescence spectroscopy analysis
Fluorescence spectroscopy of mung bean’s GADs was measured according to the methods of Zhang et al.[
1.12 Statistical analysis
The experiments were performed in triplicate, and Student’s t-test and ANOVA with the post-hoc test were performed, when appropriate, to evaluate means and standard deviation. A maximum of 5% standard deviation from the averaged values was generally tolerated (when not otherwise specified). The averaged values are documented in the respective figures.
2 Result and discussion
2.1 Molecumar composition of GAD
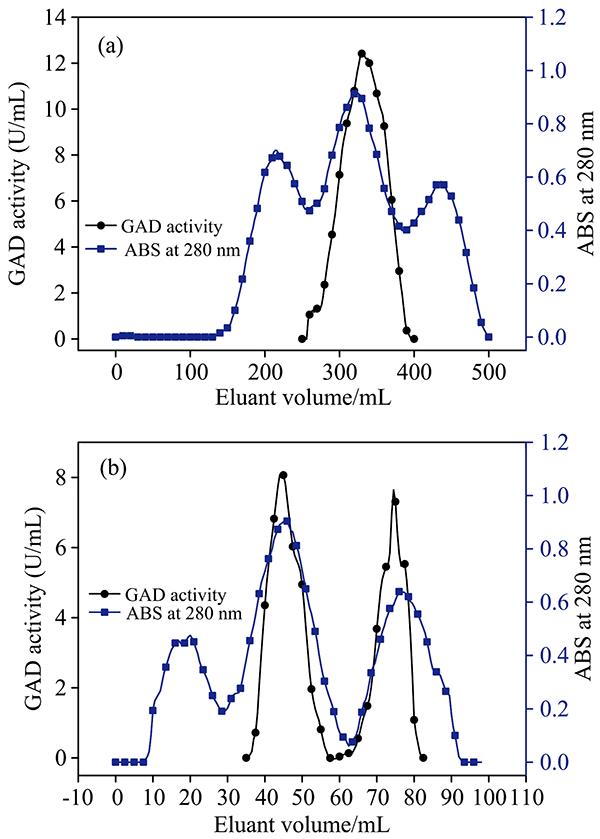
GAD in mung bean was purified by DEAE-Sepharose FF ion-exchange chromatography, Superdex-200 gel filtration chromatography, and Glu-Sepharose CL 4B affinity chromatography in this research. As depicted in Fig1A, it was interesting that there was one enzyme activity peak was observed in DEAE-Sepharose FF ion-exchange chromatography with a 57.2% recovery ratio, while we found two distinct peaks corresponding to two enzymes in Superdex-200 gel filtration chromatography [as shown Fig.1(b)]. The GAD with a higher molecular mass was labeled as GAD1 and the enzyme with less molecular mass was labeled as GAD2. The recovery ratio of Superdex-200 gel filtration chromatography for GAD1 and GAD2 were 23.1% and 19.7% respectively. It could be seen from Fig.2(a) and (b) that The further purification of GAD1 and GAD3 were performed by Glu-Sepharose CL 4B affinity chromatography with recovery ratios of 10.7% and 14.2%. As shown in Fig.3, we determined by analytical gel filtration the molecular mass for two kinds of GADs in mung bean, GAD1 has a molecular mass of 155 kDa and GAD2 has an apparent molecular mass of 75 kDa.
![]()
Figure 1.Purification of mung bean’s GAD by DEAE-Sepharose FF chromatography (a) and Superdex 200 chromatography (b)
![]()
Figure 2.Purification of mung bean’s GAD by Superdex 200 chromatography
(a): GAD1; (b): GAD2
![]()
Figure 3.HPLC separation of GAD1 and GAD2 from Mung Bean
In order to determine the subunits composition of GAD, SDS-PAGE analysis was performed as depicted in Fig.4. The SDS-PAGE profile of GAD1 showed a distinct subunit with a molecular weight of approximately 75 kDa, whereas for GAD2 a subunit with a molecular weight of 36 kDa was detected. It can be deduced that the two GADs identified in mung bean were dimers. Mung bean GAD2 is similar in molecular weight to rice germ GAD, which has a molecular weight of 40 kDa[
![]()
Figure 4.Subunit composition of mung bean GAD
2.2 Effect of pH and temperature on mung bean GAD activity
The pH-dependent stability and activity of GAD were examined, and the results are shown in Fig.5. The findings revealed the optimum activity for GAD1 and GAD2 were at pH 6.1 and pH 5.5, respectively. In comparison, the optimum pH of most plant GAD was reported to be between 5.5 and 6.5[
The activity of mung bean’s GAD1 and GAD2 were both optimal at 40 ℃, as depicted in Fig.6. The optimum temperatures for potato extracted GAD was reported to be 37 ℃[
![]()
Figure 5.The optimum pH of pH stability of GAD activity
(a): Optimum pH of GAD activity;(b): pH stability of GAD activity
![]()
Figure 6.The optimum temperature of temperature stability of GAD activity
(a): The optimum temperature of GAD activity;(b): temperature stability of GAD activity
2.3 Effect of chemical reagents on GAD activity
As shown in Table 1, KCl, MgSO4, and CaCl2 did not significantly affect GAD1 activity, whereas the GAD1 activity decreased to 81.76%, 82.45%, 85.67% and 53.62% by KI, MgSO4, AgNO3, and SDS. In general, the tested reagents did not significantly influence the GAD2 activity except AgNO3 and SDS. SDS induced denaturation of the enzyme and significantly decreasing both GAD enzymes activity. No significant difference was observed in enzymatic activity when treated with KCl, MgCl2, CaCl2, or Cl-. Treatment with I- partly inhibited the enzyme activities of both GAD enzymes.
significantly inhibited GAD1 activity, but not that of GAD2. It could be speculated that GAD1 may be activated by
. This is consistent with a previous report where treatment of the GAD2 with high concentrations of ammonium sulfate and subsequent dilution with sodium glutamate was essential for Lactobacillus Brevis GAD tetramer formation and its activation[
It was found that Tween 80 increased GAD1 and GAD2 activities, whereas SDS inhibited them. This could be due to an SDS-induced denaturation of GAD, which significantly decreases GAD1 and GAD2 activities. A similar inhibitory effect was observed in rice bran GAD, which showed an enzyme activity loss of 33.1%[
Both Ca2+ and Cu2+ could significantly activate GAD1 and GAD2, whereas Fe2+ only increased GAD2 activity. Plant GADs are be able to bind calmodulin (CaM) and require a CaM-Ca2+ complex to enhance their enzymatic activity. Soy GAD was reported to be activated via Ca2+ signal transduction, which was stimulated 2- to 8-fold in the presence of calcium2+ (Ca2+)/calmodulin (CaM) at natural pH[
2.4 Structure of GAD determined by FT-IR
The secondary structure of GAD1 and GAD2 were determined by FT-IR, as shown in Fig.7. The quantitative analysis of secondary structural components of proteins can be obtained by various experimental methods. Analysis of the second derivative of the IR-SD was considered as the most reliable quantitative method. A baseline was adjusted prior to the second-derivative analysis for the basis of further studying of Fourier self-deconvolution, which then substantially affected the determination of the bands resolved by a Gaussian curve fit. The Gaussian curve fit was adjusted to give the best least-squares fit of the individual bands to each deconvoluted spectrum, followed by a second-derivative analysis[
![]()
Figure 7.FT-IR spectrum of GAD1 and GAD2
Table Infomation Is Not EnableWe found that GAD1 contained 35.35% α-helix structure, 19.76% β-sheet, 24.65% β-turn, and 22.24% unordered structure. While GAD2 had 37.89% α-helix structure, 24.88% β-sheet, 20.87% β-turn, and 16.36% unordered structure. In comparison, the higher-ordered structure contents determined the higher stability of GAD2. In comparison, it was observed that the GAD in rice germ had a higher β-sheet content of 39%[
2.5 Structure of GAD determined by Raman
The Raman spectra of the GAD1 and GAD2 are shown in Fig.8. The assignments of some major bands are based on our previous works[
![]()
Figure 8.Raman spectrum of GAD1 and GAD2
The secondary structures of GADs were mainly determined by the Raman characteristic bands of the amide Ⅰ band. The Raman characteristic bands of amide I band are located as follows: α-helix, 1 645~1 660 cm-1; β-sheet, 1 670~1 680 cm-1; β-turn, 1 680~1 690 cm-1; random coil, 1 660~1 670 cm-1 [
Tryptophan (Trp) residue showed several characteristic Raman bands, some of which are useful to check the polarity of the microenvironment, or participate in hydrogen bonding. Li-Chan[
The tyrosyl (Tyr) double ratio (I850/830) can be used in monitoring the microenvironment around the tyrosyl residues. In fact, when tyrosine residues were buried, then the I850/830 ratio reached its minimum value of about 0.3, and the phenolic OH group acts as a strong hydrogen bond donor to an electronegative acceptor, such as carboxyl oxygen. When Tyr was exposed at the surface of the proteins, the phenolic OH acted as a donor and an acceptor for the moderate hydrogen bonds, and the I850/830 was approximately 1.25[
The band assigned to the CH2 and CH3 bending vibrations was observed around 1 450 cm-1. The decrease in the intensity of these bands indicates the exposure of aliphatic residues, while an increase indicates buried residues[
2.6 Structure of GAD determined by fluorescence spectrum
The tertiary structure of GAD was determined by fluorescence spectrum, as shown in Fig.9. GAD1 and GAD2 in pH 5.5 sodium phosphate buffer at 40 ℃ both exhibited one peak in their fluorescence emission spectra. The maximum emission (λmax) of GAD1 was located at 334.5 nm, while λmax of GAD2 was located at 333.1 nm. Commonly, when using Trp fluorescence λmax information, a Trp is assigned as being buried and in a “nonpolar” environment if λmax is <330 nm; if λmax is >330 nm, the Trp is assigned to be in a “polar” environment[
![]()
Figure 9.Fluorescence spectrum of GAD1 and GAD2
In comparison, GAD1 had the higher fluorescence intensity and larger λmax, which suggested that the microenvironment around the tryptophan residue of GAD1 tended to expose to more “polar” environment, resulting in a more flexible and exposed molecular structure, while the conformation of GAD2 was more compact and conservative, which corresponded to the higher enzyme stability.
The λmax of GAD1 in pH 4.0 buffer at 40 ℃ exhibited a red-shift from 334.5 nm (pH 5.5) to 337.1 nm, while the λmax of GAD1 in pH 7.0 buffer tended to be increased up to 335.4 nm. This phenomenon proved that the inhibition of enzymatic activity might be related to the partial unfolding of the enzyme structure. An increased λmax for GAD2 at pH 4.0 and 7.0 at 40 ℃ were also found when compared with λmax at pH 5.5, which confirmed the pH-induced structural change decreased the enzymatic activity. The basis of pH-dependent absorbance changes was excluded that high pH induces the formation of an aldimine between the internal aldimine and a GAD cysteine residue and that the low pH conformation favors the unsubstituted internal aldimine[
The λmax of GAD1 significantly increased from 334.5 to 337.1 nm when the temperature increased from 40 to 60 ℃, whereas at room temperature decreased to 333.3 nm. Slight increases were observed in λmax of GAD2 at 25 and 60 ℃, which implied that a decrease or increase in temperature causes a small conformational change in GAD2. The temperature stability of GAD2 was higher as a result of the slight structural change.
Some metal ions interfere with Fluorescence emission spectra. Thus only the fluorescence spectra of GAD combined with Ca2+ and SDS were collected. The addition of Ca2+ significantly decreased the λmax of GAD1 and GAD2. This result confirmed that Ca2+ was involved in the binding the calmodulin-binding domain of mung bean GAD then inducing a “buried” and compact structure of the enzyme. However, the addition of SDS significantly increased the λmax of both GAD1 and GAD2, showing typical unfolding profiles, which indicated that the SDS-induced unfolding of GAD impaired the enzyme activity.
3 Conclusion
Glutamate decarboxylase (GAD) catalyzes an α-decarboxylation reaction of glutamate to produce γ-aminobutyric acid GABA. In this study, two GADs were extracted and purified from mung bean for the first time. It was interesting that, unlike GADs from other species, two purified GADs with different subunits composition, molecular structures, and enzymic properties were purified in this research. The two GADs identified in mung bean were both dimers.
The effect of pH, temperature, and chemical reagents on GAD enzyme activities were studied in this research. The inhibition and promotion effect of pH, temperature, and chemical reagents were partly revealed, we found that the GAD2 had strong structural stability, and structural change induced by pH and Ca2+, which may account for the changes in enzyme activities. In general, the higher-ordered structure contents determined the higher stability of GAD2. The GAD2 had a more conservative structure than GAD1 as depicted in the fluorescence spectrum. Additionally, GAD1 had a higher content of g-g-t conformation while GAD2 had t-g-t conformation.
Though some enzymatic properties and structural properties were determined in this research, further studies on the structure and regulation of mung bean GADs activity are needed. The amino acid sequence of GAD1 and GAD2 should be analyzed in further studies to provide more structural information for the function of GAD.
References
[1] N Wu T, S Lee C, K Chen C et al. Scientific Reports, 9, 10255(2019).
[2] H Zhang, F Chen, Y Yao H et al. Food Chemistry, 101, 1670(2007).
[3] C Spink D, G Porter T, S Wu et al. Biochemical Journal, 231, 695(1985).
[4] J Kim M, S Kim K, J Jin W. Journal of Food Science, 78, 1376(2013).
[5] H Ueno. Journal of Molecular Catalysis B: Enzymatic, 10, 67(2000).
[6] F Wu, X Zhang, L Zhou et al. International Journal of Food Properties, 20, 1246(2017).
[7] F Han, Z Wang, X Sui et al. Journal of the Science of Food and Agriculture, 96, 1532(2016).
[8] J Gong, J Huang, G Xiao et al. Journal of the Institute of Brewing, 123, 417(2017).
[9] C Li, P Li, J Fan et al. Acta Universitatis Agriculturalis Boreali-Occidentalis, 29, 30(2001).
[10] X Sun C, G Liu F, W Yang et al. Rsc. Adv, 5, 15641(2015).
[11] L Jiang, Y Li, Z Wang et al. Journal of Chemistry, 1(2014).
[12] H Zhang, F Chen, Y Yao H et al. Food Chemistry, 105, 65(2007).
[13] M Iwahara, K Nishimura, K Tsuchiya. Food Science and Technology Research, 9, 3226(2003).
[14] T Matsumoto, I Yamaura, M Funatsu. Agricultural and Biological Chemistry, 50, 1413(1986).
[15] H Peng, T Yang, R Bauchan G. Horticulture Research, 14057(2014).
[16] C Slaughter J, K Inatomi. Biochemical Journal, 147, 479(1975).
[17] G Lv Y, L Wang, X Xu D et al. Journal of the Science of Food and Agriculture, 90, 1027(2010).
[18] I Yamaura, M Funatsu, T Matsumoto. Agricultural and Biological Chemistry, 54, 3001(1990).
[19] S Pilati, P Dominici, H Gut et al. Journal of Molecular Biology, 392, 334(2009).
[20] V Satyanarayan, M Nair P. European Journal of Biochemistry, 150, 53(1985).
[21] Y Ueno, K Oda, K Hiraga. and Biochemistry, 72, 1299(2008).
[22] T Arazi, H Fromm, A Snedden W et al. Plant Physiology, 108, 543(1995).
[23] J Sun L, X Lu Z, Y Yang S et al. Food Science, 49(2007).
[24] B Qing-Yun. Journal of Anhui Agricultural Sciences, 7(2011).
[25] G Lee, A Mauerer. European Journal of Pharmaceutics and Biopharmaceutics, 62, 131(2006).
[26] L Martin D, H Chen C, J Wu S. Archives of Biochemistry and Biophysics, 349, 175(1998).
[27] T Yuan, J Vogel H. Journal of Biological Chemistry, 273, 30328(1998).
[28] H Oh S, J Yun S. Molecules and Cells, 8, 125(1998).
[29] Y Yang, H Ren, L Zhou et al. Journal of Chemistry, 2016, 1(2016).
[30] E Li C. Trends in Food Science & Technology, 11, 361(1996).
[31] T Yu N, C Lord R. Journal of Molecular Biology, 50, 509(1970).
[32] M Herrero A. Critical Reviews in Food Science and Nutrition, 48, 512(2008).
[33] T Vivian J, R Callis P. Biophysical Journal, 80, 2093(2001).
[34] H O’Leary M, W Brummund. Journal of Biological Chemistry, 249, 3737(1974).
[35] A Tramonti, F Bossa, A John R et al. European Journal of Biochemistry, 269, 4913(2002).

Set citation alerts for the article
Please enter your email address
© Copyright 2018-2021 | Chinese Laser Press. All Rights Reserved 沪ICP备15018463号-20