• Photonics Research
  • Vol. 10, Issue 9, 2073 (2022)
Ke Tian1、2、†, Jibo Yu1、2、†, Fuchuan Lei3, Jonathan Ward4, Angzhen Li1、2, Pengfei Wang2、5, and Síle Nic Chormaic1、*
Author Affiliations
  • 1Okinawa Institute of Science and Technology Graduate University, Onna, Okinawa 904-0495, Japan
  • 2Key Laboratory of In-Fiber Integrated Optics of Ministry of Education, College of Physics and Optoelectronic Engineering, Harbin Engineering University, Harbin 150001, China
  • 3Department of Microtechnology and Nanoscience, Chalmers University of Technology, SE-41296 Gothenburg, Sweden
  • 4Physics Department, University College Cork, Cork, Ireland
  • 5Key Laboratory of Optoelectronic Devices and Systems of Ministry of Education and Guangdong Province, College of Optoelectronic Engineering, Shenzhen University, Shenzhen 518060, China
  • show less
    DOI: 10.1364/PRJ.459561 Cite this Article Set citation alerts
    Ke Tian, Jibo Yu, Fuchuan Lei, Jonathan Ward, Angzhen Li, Pengfei Wang, Síle Nic Chormaic. Blue band nonlinear optics and photodarkening in silica microdevices[J]. Photonics Research, 2022, 10(9): 2073 Copy Citation Text show less
    Photodarkening in optical nanofibers. (a) Experimental setup to measure the transmission through a nanofiber. TLS, tunable laser system; ATT, attenuator; and PM, power meter. (b) Normalized transmission through the 460HP nanofiber (500 nm waist) for a fixed pump power of 7 mW at 462 nm. Inset: images of the waist of the nanofiber over times of 0/30/60/120 min, the exposure time of the CCD camera was set to the lowest value at the beginning. (c) Normalized transmission through the 980HP nanofiber (500 nm waist) for a fixed pump power of 7 mW and different wavelengths. (d) Normalized transmission through the 460HP nanofiber (500 nm waist) for a fixed wavelength of 460 nm and different pump powers. The transmission of an untapered fiber is given for comparison. All transmissions measured on PM2 were normalized based on the power coupled into the tapered fiber, which is nine times the reference power as measured on PM1.
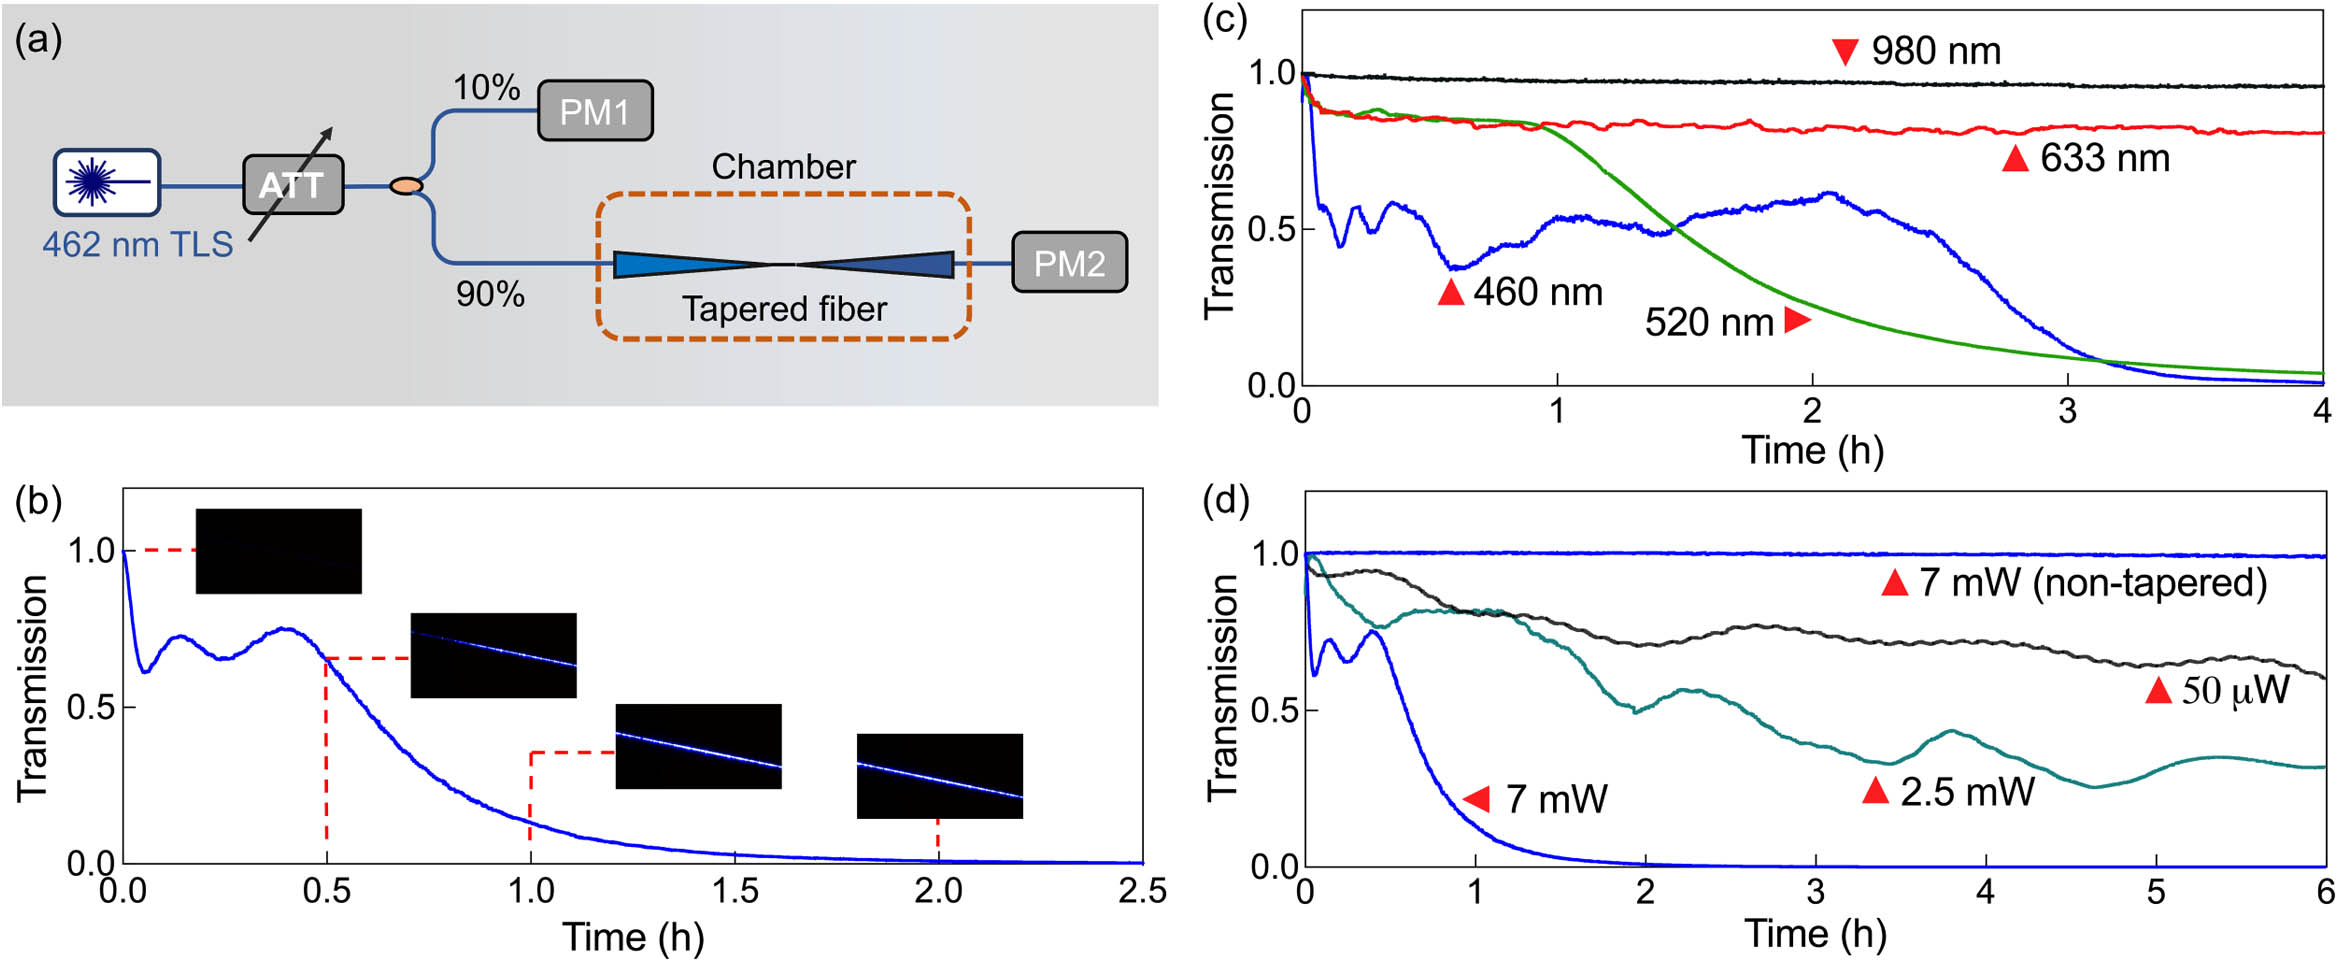
    Fig. 1. Photodarkening in optical nanofibers. (a) Experimental setup to measure the transmission through a nanofiber. TLS, tunable laser system; ATT, attenuator; and PM, power meter. (b) Normalized transmission through the 460HP nanofiber (500 nm waist) for a fixed pump power of 7 mW at 462 nm. Inset: images of the waist of the nanofiber over times of 0/30/60/120 min, the exposure time of the CCD camera was set to the lowest value at the beginning. (c) Normalized transmission through the 980HP nanofiber (500 nm waist) for a fixed pump power of 7 mW and different wavelengths. (d) Normalized transmission through the 460HP nanofiber (500 nm waist) for a fixed wavelength of 460 nm and different pump powers. The transmission of an untapered fiber is given for comparison. All transmissions measured on PM2 were normalized based on the power coupled into the tapered fiber, which is nine times the reference power as measured on PM1.
    Experimental setup to study nonlinear optical effects in a nanofiber-coupled silica microsphere. The blue solid lines represent the optical path and the black dashed lines are the electrical connections. TLS, tunable laser system; PC, polarization controller; ATT, attenuator; PM, power meter; FG, function generator; DAQ, digital acquisition card; PD, photodetector; OSA, optical spectrum analyzer.
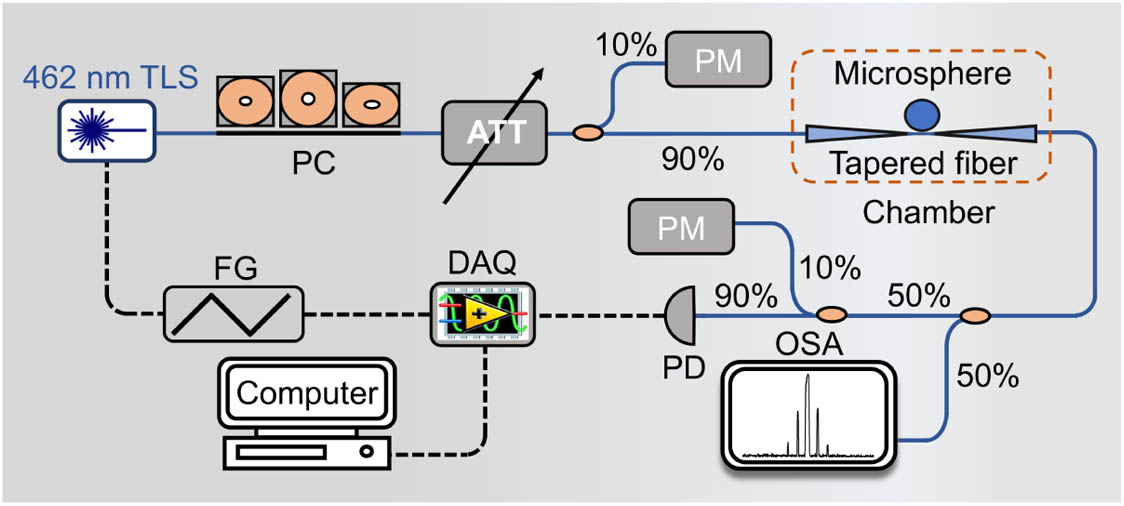
    Fig. 2. Experimental setup to study nonlinear optical effects in a nanofiber-coupled silica microsphere. The blue solid lines represent the optical path and the black dashed lines are the electrical connections. TLS, tunable laser system; PC, polarization controller; ATT, attenuator; PM, power meter; FG, function generator; DAQ, digital acquisition card; PD, photodetector; OSA, optical spectrum analyzer.
    Blue band Raman lasing. (a) Recorded stimulated Raman scattering spectra with max hold mode for 5 s at different times. (b) Corresponding transmission spectra through the nanofiber at 0 s, 480 s, and 600 s.
    Fig. 3. Blue band Raman lasing. (a) Recorded stimulated Raman scattering spectra with max hold mode for 5 s at different times. (b) Corresponding transmission spectra through the nanofiber at 0 s, 480 s, and 600 s.
    Observed frequency comb around 462 nm. d is the diameter of the silica microsphere and the FSR is about 0.48 nm.
    Fig. 4. Observed frequency comb around 462 nm. d is the diameter of the silica microsphere and the FSR is about 0.48 nm.
    Experimental setup for photodarkening and thermal bleaching. Left: image of the coupling region. The heater was controlled by a DC power supply and a thermocouple was used to monitor the temperature near the tapered fiber. Right: schematic of the experimental setup.
    Fig. 5. Experimental setup for photodarkening and thermal bleaching. Left: image of the coupling region. The heater was controlled by a DC power supply and a thermocouple was used to monitor the temperature near the tapered fiber. Right: schematic of the experimental setup.
    Thermal bleaching of a nanofiber after photodarkening. The transmission through the nanofiber for different temperatures: (a) 24–38°C (Insets: images of the waist of the nanofiber at 0/120/290 min. The exposure time of the CCD camera was set to the lowest value at the beginning); and (b) 24–50°C.
    Fig. 6. Thermal bleaching of a nanofiber after photodarkening. The transmission through the nanofiber for different temperatures: (a) 24–38°C (Insets: images of the waist of the nanofiber at 0/120/290 min. The exposure time of the CCD camera was set to the lowest value at the beginning); and (b) 24–50°C.
    Operation of a nanofiber-coupled microresonator system at different temperatures. (a) Recorded transmission through the nanofiber. The time difference between A and B, and C and D is 120 s. The corresponding WGM spectra at: (b) point A, (c) point B, (d) point C, and (e) point D.
    Fig. 7. Operation of a nanofiber-coupled microresonator system at different temperatures. (a) Recorded transmission through the nanofiber. The time difference between A and B, and C and D is 120 s. The corresponding WGM spectra at: (b) point A, (c) point B, (d) point C, and (e) point D.
    Generation of (a) stimulated Raman scattering and (b) hyperparametric oscillation in the blue band in a silica microsphere. d is the diameter of the silica microsphere and the FSR is about 0.54 nm.
    Fig. 8. Generation of (a) stimulated Raman scattering and (b) hyperparametric oscillation in the blue band in a silica microsphere. d is the diameter of the silica microsphere and the FSR is about 0.54 nm.
    Ke Tian, Jibo Yu, Fuchuan Lei, Jonathan Ward, Angzhen Li, Pengfei Wang, Síle Nic Chormaic. Blue band nonlinear optics and photodarkening in silica microdevices[J]. Photonics Research, 2022, 10(9): 2073
    Download Citation