
Ke Tian, Jibo Yu, Fuchuan Lei, Jonathan Ward, Angzhen Li, Pengfei Wang, Síle Nic Chormaic, "Blue band nonlinear optics and photodarkening in silica microdevices," Photonics Res. 10, 2073 (2022)
- Photonics Research
- Vol. 10, Issue 9, 2073 (2022)
Abstract
1. INTRODUCTION
Silica (
Conventionally, most studies on silica-based photonics, especially involving fiber optics, are conducted in the IR wavelength band. However, there is significant motivation to push silica photonics to the near-IR and visible wavelengths. Developing applications in many areas such as biological imaging, underwater communications and detection, atomic clocks, and quantum technologies all rely on wavelengths in this range [20]. To date, near-visible optically pumped parametric oscillation and Kerr frequency combs have been realized in silica WGRs [21–26]. Green and blue light generation through a third-harmonic process with near-IR pumping near 1550 nm also has been observed [27–29]. Aside from photonics, the desire to use blue light in silica devices for quantum applications is also increasing. Recently, the remote entanglement of two strontium ions via the polarization of two spontaneously emitted photons at 422 nm using a conventional single-mode fiber link was demonstrated [30]. For neutral atoms, low-power blue light at 482 nm propagating through a silica ONF was used to generate cold rubidium Rydberg atoms via a two-photon transition in the evanescent field region with the aim to develop an all-fibered quantum gate [31]. However, studies on the effects of blue light on the properties of tapered optical fibers or on nonlinear optical processes in silica resonators are very limited [32], though clearly very desirable at this time.
Here, we studied nonlinear optical effects in a silica microsphere/nanofiber coupled system pumped in the blue wavelength region. Directly pumped Raman lasing and an optical frequency comb in the blue band were generated in the resonators, even in the presence of normal dispersion and photodarkening. The creation of color centers from two-photon absorption in the blue band caused excess absorption loss. As a result, the ability of the nanofiber to transmit blue light and the optical quality of the whispering gallery modes (WGMs) appeared to degrade rapidly. Crucially, the photodarkening in the nanofibers was shown to have a sufficiently low temperature dependence, so that a small increase in ambient temperature led to effective thermal bleaching. This provided a means to recover the optical quality of the cavity and allowed for the direct generation of stable Raman lasing and an optical frequency comb in the blue region.
Sign up for Photonics Research TOC. Get the latest issue of Photonics Research delivered right to you!Sign up now
2. EXPERIMENT AND RESULTS
A. Photodarkening in Silica Nanofibers
First, we studied the transmission of blue light in an optical nanofiber. The experimental setup is schematically illustrated in Fig. 1(a). A tunable laser (DL Pro HP 461, TOPTICA Photonics AG) with a center wavelength of 462 nm was used as the light source. The light was coupled into a single-mode fiber (SMF, 460HP, Thorlabs), and then passed through an attenuator (ATT) and a 90/10 inline beam splitter (BS). The 10% port was connected to a power meter and the 90% port was connected to the nanofiber. The output power from the nanofiber was recorded by another power meter. The nanofiber, with a minimum diameter at the waist of 500 nm, was made from the same 460HP fiber using the heat-and-pull method with a ceramic microheater [33]. A 500 nm diameter tapered fiber allows transmission of only a few modes (
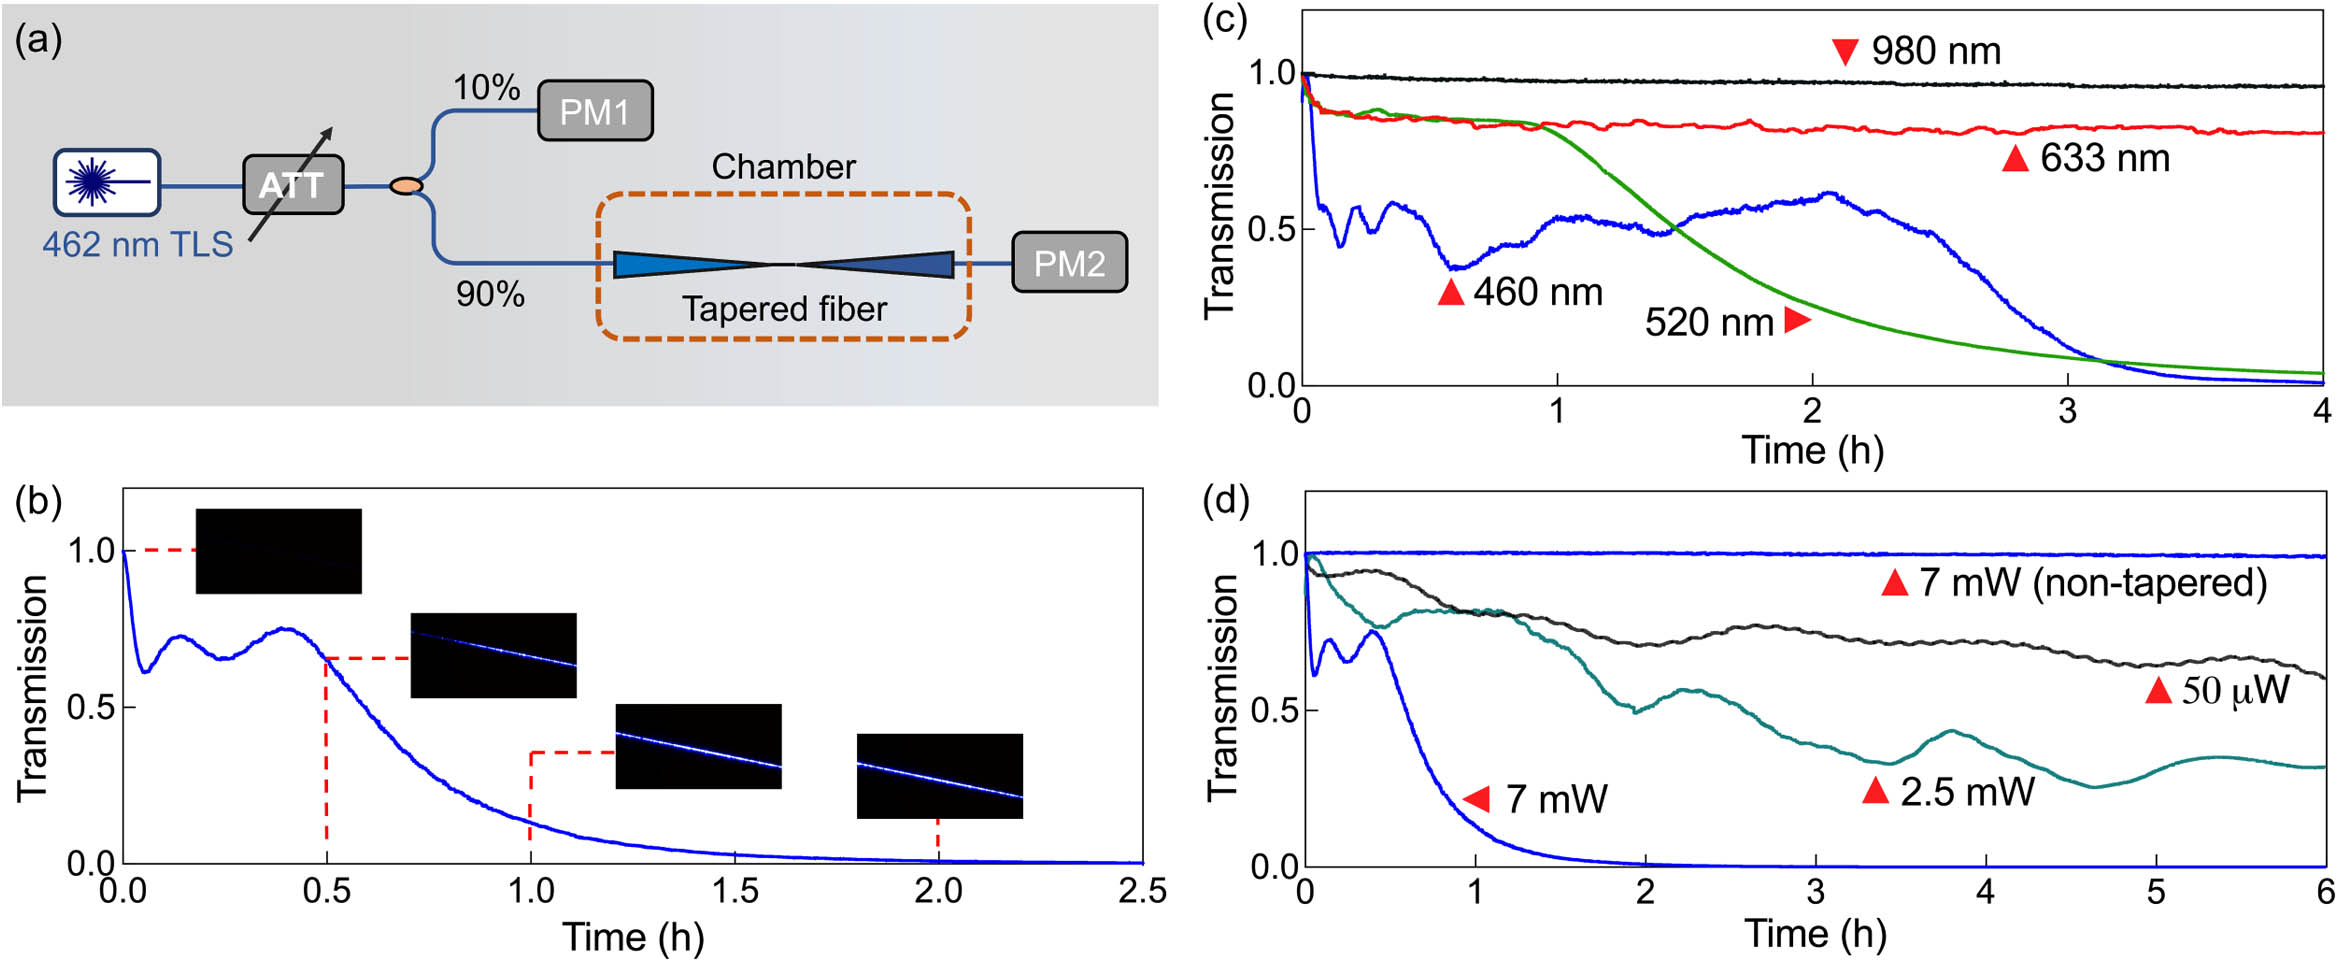
Figure 1.Photodarkening in optical nanofibers. (a) Experimental setup to measure the transmission through a nanofiber. TLS, tunable laser system; ATT, attenuator; and PM, power meter. (b) Normalized transmission through the 460HP nanofiber (500 nm waist) for a fixed pump power of 7 mW at 462 nm. Inset: images of the waist of the nanofiber over times of 0/30/60/120 min, the exposure time of the CCD camera was set to the lowest value at the beginning. (c) Normalized transmission through the 980HP nanofiber (500 nm waist) for a fixed pump power of 7 mW and different wavelengths. (d) Normalized transmission through the 460HP nanofiber (500 nm waist) for a fixed wavelength of 460 nm and different pump powers. The transmission of an untapered fiber is given for comparison. All transmissions measured on PM2 were normalized based on the power coupled into the tapered fiber, which is nine times the reference power as measured on PM1.
Figure 1(b) shows the transmission through the nanofiber at a fixed pump power of 7 mW. The transmission dropped rapidly to 62% in 3 min, then oscillated for 20 min, and finally decayed close to zero after 2 h. A CCD camera was used to image and record the evolution of the scattered light from the nanofiber and images at different time intervals are shown as insets in Fig. 1(b). As the loss of the 462 nm light in the nanofiber increased with time, the brightness of the scattered light also gradually increased. Analyzing the images reveals the number of scattering points activated over time for a length of 900 μm along the taper waist. Initially, as shown in the first image in Fig. 1(b), there are approximately 10 dim scattering points on the waist of the nanofiber. As time progresses, these points become brighter and new points appear, increasing to at least 100 bright scattering points after 2 h, with about one scatterer every 9 μm. It is worth emphasizing that the observed scattered light was not caused by dust particles, since the nanofiber was kept in a clean chamber and a similar phenomenon was not observed when pumping at 980 nm. After irradiation, the nanofiber was examined with an SEM and no trace of contamination or damage was found on its surface. These observations lead us to believe the loss in transmission of the nanofiber was caused by photodarkening resulting from the photoactivation of color centers.
To better understand the photodarkening wavelength dependence in very thin tapered fibers, the transmission of light through a 500 nm waist nanofiber as a function of time was characterized using lasers with wavelengths of 980 nm, 633 nm, 520 nm, and 462 nm. A 980HP fiber (core diameter 3.6 μm) was used since it has a larger core than the 460HP fiber (core diameter 2.5 μm) used in the previous tests. This ensured easier coupling of light into the fiber over a wide range of wavelengths. The pump power coupled into the fiber was 7 mW for each wavelength and was kept constant throughout. A typical normalized transmission signal as a function of time is shown in Fig. 1(c). It can be seen that, for this particular fiber sample, the transmission decreased at different rates for the different wavelengths. The reduction in the transmission at 980 nm was slow and only 0.04% over the test time (more than 4 h). At 633 nm, the light initially decayed rapidly with an exponential time constant of 6 min; however, after 20 min, the normalized transmission remained nearly fixed at 80%. At shorter wavelengths, the behavior was noticeably different; the transmission for 520 nm was similar to that for 633 nm for the first hour, but it decreased to 4% after 4 h with an exponential time constant of 50 min. For 460 nm light, the transmission dropped rapidly to 62% in 4 min, then oscillated for 2.5 h, and finally decayed to 1% after 4 h with an exponential time constant of 25 min. These results demonstrate that, for the same input power, the power drop at shorter wavelengths was much more significant and displayed unusual characteristics. This phenomenon followed the same trend as photodarkening in untapered doped fibers [34,35] and points to photodarkening being the dominant process behind the observed behavior in our nanofibers.
Excess optical loss caused by photodarkening in untapered fibers can be related to the intensity of the pump light [36]. Therefore, we investigated the transmission through a nanofiber at a wavelength of 462 nm over time for different input powers. The nanofibers were made from 460HP fiber and the diameter was approximately 500 nm in each case. The results are shown in Fig. 1(d) and, as a reference, the transmission through an untapered 460HP fiber is also presented. The transmission of the untapered fiber was reduced by only 0.9% over 6 h for an input power of 7 mW. However, for the tapered fibers, their transmission was unstable when the input power exceeded 50 μW. As the power increased from 50 μW to 7 mW, the power downtrend was more dramatic. Although the transmission can remain stable for lower powers for a reasonable period of time, 50 μW is generally not sufficient to reach the threshold needed for the observation of nonlinear optical effects in WGRs, such as SRS and hyperparametric oscillation. In contrast to the studies on photodarkening in commercial optical fibers when using high powers (typically a few watts) [37–39], the threshold for photodarkening in the nanofibers reported herein was very low (
B. Blue Band Nonlinear Optics in a Nanofiber-Coupled Silica WGR
Tapered optical fibers are frequently used as couplers to excite modes in WGRs. When pump light is coupled from a fiber to the resonator, the optical intensity may be further amplified in the cavity due to its small mode volume and high optical quality factor (
![]()
Figure 2.Experimental setup to study nonlinear optical effects in a nanofiber-coupled silica microsphere. The blue solid lines represent the optical path and the black dashed lines are the electrical connections. TLS, tunable laser system; PC, polarization controller; ATT, attenuator; PM, power meter; FG, function generator; DAQ, digital acquisition card; PD, photodetector; OSA, optical spectrum analyzer.
For the measurements, a silica microsphere with a diameter of
![]()
Figure 3.Blue band Raman lasing. (a) Recorded stimulated Raman scattering spectra with max hold mode for 5 s at different times. (b) Corresponding transmission spectra through the nanofiber at 0 s, 480 s, and 600 s.
The evolution of the SRS spectra can be understood by monitoring the corresponding WGM spectra, shown in Fig. 3(b). The spectrum was dominated by thermally broadened modes that covered nearly the entire range of the laser scan; strong thermal broadening is associated with high
Critically, once a microsphere was pumped with blue laser light, it was degraded to such a point that it could no longer support SRS. This was verified by replacing the nanofiber with a newly fabricated one (with the same dimensions) and then pumping the degraded microsphere with the same power (12 mW). We found that SRS was no longer achievable, even for different coupling positions and laser detunings.
Apart from SRS, a Kerr nonlinearity-based frequency comb in the blue band was also studied. A new microsphere was made and coupled to a nanofiber by scanning the frequency of the pump laser and adjusting the polarization state at the fiber waist. A Kerr frequency comb with 13 teeth was excited for an input power of
![]()
Figure 4.Observed frequency comb around 462 nm.
Due to the strong photodarkening in the blue band, the higher pump powers needed for comb generation, and the significantly larger circulating intensity in the sphere compared to the tapered fiber, the observed Kerr frequency combs were difficult to maintain for a long period of time. The unstable and dynamic behavior of the high
C. Thermal Bleaching of Photodarkening in Silica Nanofibers
As reported in the literature, the effect of photodarkening can be reduced by thermal bleaching and photobleaching [34,35,44–46]. The color centers are strongly influenced by temperature over a wide range. For example, the concentration of the defects is strongly dependent on temperature from 10 K to above 600 K [35,47], probably due to diffusion and reactions with mobile hydrogen in the glass. Experimental evidence [48] indicates that atomic hydrogen (
![]()
Figure 5.Experimental setup for photodarkening and thermal bleaching. Left: image of the coupling region. The heater was controlled by a DC power supply and a thermocouple was used to monitor the temperature near the tapered fiber. Right: schematic of the experimental setup.
Figures 6(a) and 6(b) show the photodarkening and thermal bleaching processes at different temperatures for an input laser power of 7 mW at 462 nm. The heater was turned off for the first 2 h and the ambient temperature was 24°C. During this time, the transmission decreased, consistent with the result in Fig. 1(d). After 2 h, when the transmission was reduced to only a few percent, the heater was turned on and the temperature was stabilized at 38°C and 50°C for two different nanofibers. We observed that the photodarkening could be completely bleached with recovery times of 167 min for 38°C and 58 min for 50°C. Hence, photodarkening can be overcome in an environment close to room temperature. It is worth noting that one does not need to wait until the appearance of photodarkening to perform thermal bleaching; i.e., the heater can be turned on immediately to prevent photodarkening from occurring.
![]()
Figure 6.Thermal bleaching of a nanofiber after photodarkening. The transmission through the nanofiber for different temperatures: (a) 24–38°C (Insets: images of the waist of the nanofiber at 0/120/290 min. The exposure time of the CCD camera was set to the lowest value at the beginning); and (b) 24–50°C.
D. Stabilization of Blue Band Nonlinear Optics Using Thermal Bleaching
Next, we confirmed the role of thermal bleaching in a nanofiber-coupled microresonator system and used the above method to prevent excessive photodarkening from disturbing the nonlinear processes in the cavity. The transmission through the nanofiber and the WGMs spectra were recorded simultaneously, as shown in Fig. 7. The nanofiber transmission was recorded over several minutes at 24°C with an input power of 1 mW. It is clear that the transmission through the nanofiber reduced over time, at a rate of
![]()
Figure 7.Operation of a nanofiber-coupled microresonator system at different temperatures. (a) Recorded transmission through the nanofiber. The time difference between A and B, and C and D is 120 s. The corresponding WGM spectra at: (b) point A, (c) point B, (d) point C, and (e) point D.
The experiment was repeated at 38°C with the same nanofiber and microsphere. First, photodarkening in the nanofiber was thermally bleached before making contact with the microsphere. As the temperature was raised from 24°C to 38°C, the transmission increased exponentially from 50% to nearly 100% in a matter of minutes. Once the transmission was relatively stable, the microsphere was placed in contact with the nanofiber waist, as shown in point C in Fig. 7(a). After the microsphere was coupled, the transmission remained constant (slope
![]()
Figure 8.Generation of (a) stimulated Raman scattering and (b) hyperparametric oscillation in the blue band in a silica microsphere.
3. DISCUSSION
There are a variety of mechanisms for the generation of color centers that lead to photodarkening at 462 nm. Generally, it is considered to be due to intrinsic stable defects in the form of “E” centers, oxygen deficiency centers (ODCs), oxygen (excess) interstitial centers, or peroxy radicals [52–54]. These defects have numerous absorption bands; however, of particular interest to optical pumping at 462 nm, are the “E” center absorption bands at 210 nm and 250 nm, and the 245 nm absorption band of the divalent ODC(II) [54], which has a photoluminescence band at 460 nm. The peroxy radical has two absorption bands of interest at 620 nm and 258 nm [52,53,55]. Another common color center in pure silica is a partially bound oxygen atom with one free electron, which is the nonbridging oxygen hole center (NBOHC) [39]. The NBOHC has two absorption bands at 620 nm and 258 nm. This defect often forms as a result of optically induced breaking of a bond in a stressed multiple member Si-O ring [39]. In Ge-doped silica there are Ge(1) and Ge(2) centers with absorption bands around, respectively, 281 nm and 213 nm [53]. It is also noted that dangling bonds on the surface of the silica play a role in some laser-induced color centers [54]. In addition to the stable defects, there are unstable self-trapped excitons (STEs), which occur when an electron is directly transported to the conduction band, leaving a hole in the valence band. This happens after laser excitation by a multiphoton absorption process. Generation of excitons leads to the creation of additional levels below the conduction band, changing the optical properties of the glass [55]. This is a strong candidate for loss at 462 nm since it has absorption peaks at 460 nm; however, it has been noted that the bulk silica absorption can shift to longer wavelengths when the glass is drawn into a fiber [53] (and [21] within [53]). Apart from drawing-induced changes, the defects are thermally sensitive and can migrate and recombine when heated or cooled [47]. For example, the movement/displacement of the atomic oxygen from STE sites results in the formation of the E centers and NBOHCs. The unexpected sensitivity of the photodarkening to small changes in temperature observed in our result is not fully explored and beyond the scope of this paper. However, it would seem that nano- and microphotonic silica devices operate in a region where even a few color centers restrict performance. If we now consider that the mobility of the defect centers is dependent on temperature and the color center population affects the refractive index [46], it seems likely that such ultrasensitive devices are subject to the dynamics of these defects.
4. CONCLUSION
In conclusion, blue band nonlinear optics effects in a nanofiber-coupled silica microresonator were investigated experimentally with directly pumped hyperparametric oscillation and SRS being demonstrated in a silica microresonator at 462 nm. Due to the high optical intensity in nanofibers and microresonators, photodarkening is unavoidable and occurs at very low pump powers around 50 μW. As a result, the fiber transmission, Raman, and Kerr frequency comb signals cannot be maintained for reasonable pump powers. These results imply that photodarkening hinders the advancement of nonlinear photonics at short wavelengths in silica-based devices. Crucially, the photodarkening was demonstrated to be sensitive to small changes in ambient temperature. Taking advantage of this, in-situ thermal bleaching proved to be an effective method to mitigate photodarkening losses, thereby enabling us to study blue band nonlinear effects in silica resonators. Up to three orders of cascaded SRS and two orders of hyperparametric oscillation were achieved in the presence of a slightly elevated ambient temperature during optical pumping. In addition, the results presented here also illustrate that the tapered optical fiber could be used as a tool to observe, in situ, the dynamics of color center formation. The 1D ultrathin fiber provides us with an easy technique to image the process and could facilitate the study of color centers in different materials using sub mW pump powers.
Acknowledgment
Acknowledgment. The authors acknowledge S. Kasumie and J.-B. Clément for early contributions to this work. K.T. acknowledges support from the JSPS Grant-in-Aid for Early-Career Scientists (Kakenhi).
References
[1] A. J. Ikushima, T. Fujiwara, K. Saito. Silica glass: a material for photonics. J. Appl. Phys., 88, 1201-1213(2000).
[2] S. M. Spillane, T. J. Kippenberg, K. J. Vahala. Ultralow-threshold Raman laser using a spherical dielectric microcavity. Nature, 415, 621-623(2002).
[3] D. K. Armani, T. J. Kippenberg, S. M. Spillane, K. J. Vahala. Ultra-high-
[4] T. Kippenberg, S. Spillane, K. Vahala. Kerr-nonlinearity optical parametric oscillation in an ultrahigh-
[5] Y. Yang, Y. Ooka, R. M. Thompson, J. M. Ward, S. Nic Chormaic. Degenerate four-wave mixing in a silica hollow bottle-like microresonator. Opt. Lett., 41, 575-578(2016).
[6] T. Aoki, B. Dayan, E. Wilcut, W. P. Bowen, A. S. Parkins, T. Kippenberg, K. Vahala, H. Kimble. Observation of strong coupling between one atom and a monolithic microresonator. Nature, 443, 671-674(2006).
[7] F. Lei, J. M. Ward, P. Romagnoli, S. Nic Chormaic. Polarization-controlled cavity input-output relations. Phys. Rev. Lett., 124, 103902(2020).
[8] M. Baaske, M. Foreman, F. Vollmer. Single-molecule nucleic acid interactions monitored on a label-free microcavity biosensor platform. Nat. Nanotechnol., 9, 933-939(2014).
[9] Y. Yang, R. Madugani, S. Kasumie, J. M. Ward, S. Nic Chormaic. Cavity ring-up spectroscopy for dissipative and dispersive sensing in a whispering gallery mode resonator. Appl. Phys. B, 122, 291(2016).
[10] L. T. Hogan, E. H. Horak, J. M. Ward, K. A. Knapper, S. Nic Chormaic, R. H. Goldsmith. Toward real-time monitoring and control of single nanoparticle properties with a microbubble resonator spectrometer. ACS Nano, 13, 12743-12757(2019).
[11] L. Tong, R. Gattass, J. B. Ashcom, S. He, J. Lou, M. Shen, I. Maxwell, E. Mazur. Subwavelength-diameter silica wires for low-loss optical wave guiding. Nature, 426, 816-819(2003).
[12] J. C. Knight, G. Cheung, F. Jacques, T. A. Birks. Phase-matched excitation of whispering-gallery-mode resonances by a fiber taper. Opt. Lett., 22, 1129-1131(1997).
[13] F. Lei, G. Tkachenko, X. Jiang, J. M. Ward, L. Yang, S. Nic Chormaic. Enhanced directional coupling of light with a whispering gallery microcavity. ACS Photon., 7, 361-365(2020).
[14] T. Birks, W. Wadsworth, P. St.J. Russell. Supercontinuum generation in tapered fibers. Opt. Lett., 25, 1415-1417(2000).
[15] A. Cavanna, J. Hammer, C. Okoth, E. Ortiz-Ricardo, H. Cruz-Ramirez, K. Garay-Palmett, A. B. U’Ren, M. H. Frosz, X. Jiang, N. Y. Joly, M. V. Chekhova. Progress toward third-order parametric down-conversion in optical fibers. Phys. Rev. A, 101, 033840(2020).
[16] D. J. Moss, R. Morandotti, A. L. Gaeta, M. Lipson. New CMOS-compatible platforms based on silicon nitride and Hydex for nonlinear optics. Nat. Photonics, 7, 597-607(2013).
[17] T. J. Morin, L. Chang, W. Jin, C. Li, J. Guo, H. Park, M. A. Tran, T. Komljenovic, J. E. Bowers. CMOS-foundry-based blue and violet photonics. Optica, 8, 755-756(2021).
[18] Z. Ye, P. Zhao, K. Twayana, M. Karlsson, V. Torres-Company, P. A. Andrekson. Overcoming the quantum limit of optical amplification in monolithic waveguides. Sci. Adv., 7, eabi8150(2021).
[19] J. Jian, P. Xu, H. Chen, M. He, Z. Wu, L. Zhou, L. Liu, C. Yang, S. Yu. High-efficiency hybrid amorphous silicon grating couplers for sub-micron-sized lithium niobate waveguides. Opt. Express, 26, 29651-29658(2018).
[20] Ş. K. Özdemir, J. Zhu, X. Yang, B. Peng, H. Yilmaz, L. He, F. Monifi, S. H. Huang, G. L. Long, L. Yang. Highly sensitive detection of nanoparticles with a self-referenced and self-heterodyned whispering-gallery Raman microlaser. Proc. Natl. Acad. Sci. USA, 111, E3836-E3844(2014).
[21] A. Savchenkov, A. Matsko, W. Liang, V. Ilchenko, D. Seidel, L. Maleki. Kerr combs with selectable central frequency. Nat. Photonics, 5, 293-296(2011).
[22] Y. Yang, X. Jiang, S. Kasumie, G. Zhao, L. Xu, J. M. Ward, L. Yang, S. Nic Chormaic. Four-wave mixing parametric oscillation and frequency comb generation at visible wavelengths in a silica microbubble resonator. Opt. Lett., 41, 5266-5269(2016).
[23] S. H. Lee, D. Y. Oh, Q.-F. Yang, B. Shen, H. Wang, K. Y. Yang, Y.-H. Lai, X. Yi, X. Li, K. Vahala. Towards visible soliton microcomb generation. Nat. Commun., 8, 1295(2017).
[24] S. Kasumie, Y. Yong, J. M. Ward, S. Nic Chormaic. Towards visible frequency comb generation using a hollow WGM resonator. Rev. Laser Eng., 46, 92-96(2018).
[25] J. Ma, L. Xiao, J. Gu, H. Li, X. Cheng, G. He, X. Jiang, M. Xiao. Visible Kerr comb generation in a high-
[26] A. A. Savchenkov, A. B. Matsko, S. Williams. Coupler-induced phase matching of resonant hyperparametric scattering. Opt. Lett., 45, 3609-3612(2020).
[27] T. Carmon, K. J. Vahala. Visible continuous emission from a silica microphotonic device by third-harmonic generation. Nat. Phys., 3, 430-435(2007).
[28] S. Fujii, T. Kato, R. Suzuki, T. Tanabe. Third-harmonic blue light generation from Kerr clustered combs and dispersive waves. Opt. Lett., 42, 2010-2013(2017).
[29] H.-J. Chen, Q.-X. Ji, H. Wang, Q.-F. Yang, Q.-T. Cao, Q. Gong, X. Yi, Y.-F. Xiao. Chaos-assisted two-octave-spanning microcombs. Nat. Commun., 11, 2336(2020).
[30] L. J. Stephenson, D. P. Nadlinger, B. C. Nichol, S. An, P. Drmota, T. G. Ballance, K. Thirumalai, J. F. Goodwin, D. M. Lucas, C. J. Ballance. High-rate, high-fidelity entanglement of qubits across an elementary quantum network. Phys. Rev. Lett., 124, 110501(2020).
[31] K. S. Rajasree, T. Ray, K. Karlsson, J. L. Everett, S. Nic Chormaic. Generation of cold Rydberg atoms at submicron distances from an optical nanofiber. Phys. Rev. Res., 2, 012038(2020).
[32] S. Nic Chormaic. Nonlinear optics and sensing using WGM resonators. Proc. SPIE, 11700, 117002P(2021).
[33] L. Ding, C. Belacel, S. Ducci, G. Leo, I. Favero. Ultralow loss single-mode silica tapers manufactured by a microheater. Appl. Opt., 49, 2441-2445(2010).
[34] N. Zhao, Y. Wang, J. Li, C. Liu, J. Peng, H. Li, N. Dai, L. Yang, J. Li. Investigation of cerium influence on photo-darkening and photo-bleaching in Yb-doped fibers. Appl. Phys. A, 122, 75(2016).
[35] Q. Zhao, Q. Hao, Y. Luo, X. Li, S. Cui, F. Tan, C. Yu, G.-D. Peng. Photo-induced bleaching and thermally stimulated recovery of BAC-P in Bi-doped phosphosilicate fibers. Opt. Lett., 45, 5389-5392(2020).
[36] S. Jetschke, S. Unger, U. Röpke, J. Kirchhof. Photodarkening in Yb doped fibers: experimental evidence of equilibrium states depending on the pump power. Opt. Express, 15, 14838-14843(2007).
[37] H.-J. Otto, N. Modsching, C. Jauregui, J. Limpert, A. Tünnermann. Impact of photodarkening on the mode instability threshold. Opt. Express, 23, 15265-15277(2015).
[38] B. Ward. Theory and modeling of photodarkening-induced quasi static degradation in fiber amplifiers. Opt. Express, 24, 3488-3501(2016).
[39] J. Stone, W. Wadsworth, J. Knight. 1064 nm laser-induced defects in pure SiO2 fibers. Opt. Lett., 38, 2717-2719(2013).
[40] K. Tian, J. Yu, X. Wang, H. Zhao, D. Liu, E. Lewis, G. Farrell, P. Wang. Miniature Fabry–Perot interferometer based on a movable microsphere reflector. Opt. Lett., 45, 787-790(2020).
[41] Y. Liu, Y. Xuan, X. Xue, P.-H. Wang, S. Chen, A. J. Metcalf, J. Wang, D. E. Leaird, M. Qi, A. M. Weiner. Investigation of mode coupling in normal-dispersion silicon nitride microresonators for Kerr frequency comb generation. Optica, 1, 137-144(2014).
[42] A. Savchenkov, A. Matsko, W. Liang, V. Ilchenko, D. Seidel, L. Maleki. Kerr frequency comb generation in overmoded resonators. Opt. Express, 20, 27290-27298(2012).
[43] V. Lobanov, G. Lihachev, T. Kippenberg, M. Gorodetsky. Frequency combs and platicons in optical microresonators with normal GVD. Opt. Express, 23, 7713-7721(2015).
[44] M. J. Söderlund, J. J. Montiel i Ponsoda, J. P. Koplow, S. Honkanen. Thermal bleaching of photodarkening in ytterbium-doped fibers. Proc. SPIE, 7580, 75800B(2010).
[45] Y. Liu, Y. Xing, G. Chen, J. Peng, H. Li, N. Dai, J. Li. Thermal bleaching of photodarkening and heat-induced loss and spectral broadening in Tm3+-doped fibers. Opt. Express, 28, 21845-21853(2020).
[46] L. Dong, J. Archambault, L. Reekie, P. St.J. Russell, D. Payne. Photoinduced absorption change in germanosilicate preforms: evidence for the color-center model of photosensitivity. Appl. Opt., 34, 3436-3440(1995).
[47] K. Kajihara, L. Skuja, M. Hirano, H. Hosono. Interconversion between non-bridging oxygen hole center and peroxy radical in F2-laser-irradiated SiO2 glass. J. Non-Cryst. Solids, 345, 219-223(2004).
[48] K. Kajihara, L. Skuja, M. Hirano, H. Hosono. Diffusion and reactions of hydrogen in F2-laser-irradiated SiO2 glass. Phys. Rev. Lett., 89, 135507(2002).
[49] U. Ullah, M. I. Cheema. Spatiotemporal thermal analysis of tapered fibers in optical cavity sensing applications at 633 nm and 1550 nm. OSA Contin., 4, 2734-2746(2021).
[50] F. Lei, R. M. Murphy, J. M. Ward, Y. Yang, S. Nic Chormaic. Bandpass transmission spectra of a whispering-gallery microcavity coupled to an ultrathin fiber. Photon. Res., 5, 362-366(2017).
[51] S. Kasumie, F. Lei, J. M. Ward, X. Jiang, L. Yang, S. Nic Chormaic. Raman laser switching induced by cascaded light scattering. Laser Photon. Rev., 13, 1900138(2019).
[52] D. L. Griscom. Optical properties and structure of defects in silica glass. J. Ceram. Soc. Jpn., 99, 923-942(1991).
[53] D. L. Griscom. A minireview of the natures of radiation-induced point defects in pure and doped silica glasses and their visible/near-IR absorption bands, with emphasis on self-trapped holes and how they can be controlled. Phys. Res. Int., 2013, 379041(2013).
[54] L. Skuja, H. Hosono, M. Hirano. Laser-induced color centers in silica. Proc. SPIE, 4347, 155-168(2001).
[55] K. Mishchik. Ultrafast laser-induced modification of optical glasses: a spectroscopy insight into the microscopic mechanisms(2012).


Set citation alerts for the article
Please enter your email address

© Copyright 2018-2021 | Chinese Laser Press. All Rights Reserved 沪ICP备15018463号-20