
Gao Feng, Fan Jinyu, Kong Wen, Shi Guohua. Research Progress on Optical Coherence Tomography in Detecting Vascular Flow Field[J]. Chinese Journal of Lasers, 2018, 45(2): 207019
- Chinese Journal of Lasers
- Vol. 45, Issue 2, 207019 (2018)
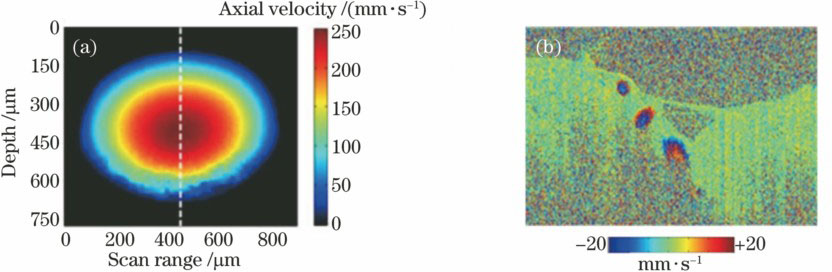
Fig. 1. (a) Flow rate of blood in a capillary tube; (b) flow rate of blood in retinal blood vessel
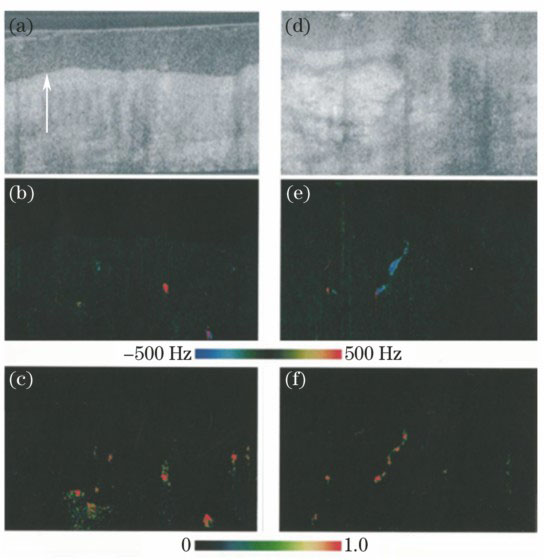
Fig. 2. Tomographic images of a left upper extremity Port-wine stain. (a)(d) Structural images; (b)(e) Doppler- shift images; (c)(f) Doppler variance images
Fig. 3. In vivo OCT imaging of mouse's brain. (a) Structural image; (b) PRDV image without bulk phase removal; (c) PRCD image without bulk phase removal; (d) IBDV image; (e) PRDV image with bulk phase removal; (f) PRCD image with bulk phase removal
Fig. 4. Angiography images of mouse's skin. (a) Image of tested mouse; (b) microscopy image; (c) fluorescence confocal image; (d) angiography image by speckle variance
Fig. 5. Flow charts of SSADA. (a) Schematic of band-pass filtering to reduce spectrum width; (b) schematic of using SSADA to improve average signal to noise ratio
Fig. 6. OCT images of optic nerve head in eye. (a) Structural image; (b) SSADA image; (c) SSADA image after removing choroid
Fig. 7. In vivo optical angiography of an adult mouse's brain. (a) Interference signal; (b) imaging result obtained from (a) by optical angiography; (c) fused final optical angiography image of the slice showing the location of moving blood
Fig. 8. Flow chart of DOMAG
Fig. 9. Angiography images of mouse's brain. (a) OMAG; (b) DOMAG
Fig. 10. Phase correction with mirror. (a) The implementation of a calibration mirror used to generate a calibration signal; (b) a representative A-line showing the signal from the sample (tissue) and the calibration signal
Fig. 11. Schematic representation of the phase-stabilization algorithm. (a) Two A-lines and their MZI signals plotted as a function of sample number. Thecolorbar shows the wavenumber distribution; (b) the unwrapped local phase of the MZI signals as a function of sample number; (c) the MZI signals plotted as a function of the unwrapped local phase; (d) unwrapped phase curves as a function of sample number after correction for shifts as measured by cross-correlation (red curve shifted down compared to (b))
Fig. 12. (a)(b) Structural images of optic nerve head before and after phase correction; (c)(d) phase-resolved Doppler images before and after phase correction
Fig. 13. High sensitivity microangiography of mouse' s brain. (a) Sectional view of two-dimensional angiography; (b) front view of three-dimensional angiography
Fig. 14. Example of the backstitched B-scan (in blue) that is used for inter-B-scan phase resolved optical frequency domain imaging. (a) Image of obtaining specific time intervals by B-scan; (b) structural image obtained from the first B-scan; (c) structural image obtained from the second B-scan
Fig. 15. Angiography images of macular area (2.1mm×2.1 mm) of retina with different time intervals
Fig. 16. (a) In-vivo OCT structure and (b) PRODTphase-resolved ODT images without bulk-motion correction of human retina; (c) histogram of the phase difference distribution for the A-line indicated by the red vertical line in (b); (d) accumulated bulk-motion phase of all the A-lines; (e) PRODT images with bulk-motion correction

Set citation alerts for the article
Please enter your email address
© Copyright 2018-2021 | Chinese Laser Press. All Rights Reserved 沪ICP备15018463号-20