• Opto-Electronic Advances
  • Vol. 1, Issue 4, 180008-1 (2018)
Daniela Serien and Koji Sugioka*
Author Affiliations
  • Advanced Laser Processing Research Team, RIKEN Center for Advanced Photonics, 2-1 Hirosawa, Wako, Saitama 351-0198, Japan
  • show less
    DOI: 10.29026/oea.2018.180008 Cite this Article
    Daniela Serien, Koji Sugioka. Fabrication of three-dimensional proteinaceous micro- and nano-structures by femtosecond laser cross-linking[J]. Opto-Electronic Advances, 2018, 1(4): 180008-1 Copy Citation Text show less
    Laser writing system for microfabrication of proteinaceous structures.(a) Laser writing system is composed of three basic components: a laser, a lens and mirror system, and an objective lens. The beam is directed towards the sample mounted on a scanning stage, optionally observed with a white light camera setup. The system is controlled by a computer. The laser beam typically has a spatially Gaussian profile. In a plane perpendicular to the laser beam axis, the cross-linking occurs only in the beam where the intensity exceeds a threshold that is dependent on wavelength, absorption scheme (single or multiphoton absorption) and the protein precursor. (b) In volume, protein cross-linking occurs in the laser focus along the writing path in the protein precursor material. Diameter and height of volume elements, so-called voxel, in a free space become ellipsoidal shapes due to mismatch between focused spot sizes and Rayleigh length, as indicated by dashed and solid lines. On the substrate, surface bound structures are formed, depending on the position of focus. Determining resolution as the smallest distance between distinguishable structures, well-connected 3D structures can be formed by scanning the focused laser beam with a step smaller than the resolution. The box inset shows that protein molecules (light blue) in the precursor are interacted with photoactivator (orange) to be cross-linked (dark blue). The circular inset shows an SEM image of an icosahedron with submicron feature sizes, scale bar represents 1 μm, reprinted from ref. 33, with the permission of AIP Publishing, copyright 2015.
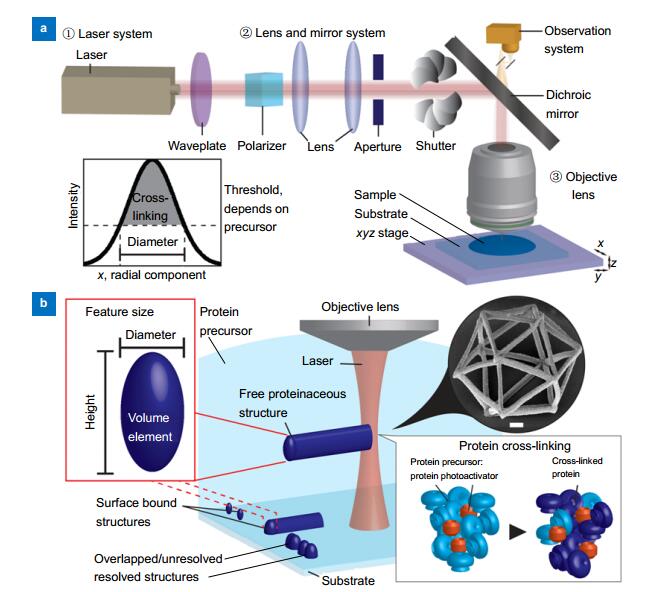
    Fig. 1. Laser writing system for microfabrication of proteinaceous structures.(a) Laser writing system is composed of three basic components: a laser, a lens and mirror system, and an objective lens. The beam is directed towards the sample mounted on a scanning stage, optionally observed with a white light camera setup. The system is controlled by a computer. The laser beam typically has a spatially Gaussian profile. In a plane perpendicular to the laser beam axis, the cross-linking occurs only in the beam where the intensity exceeds a threshold that is dependent on wavelength, absorption scheme (single or multiphoton absorption) and the protein precursor. (b) In volume, protein cross-linking occurs in the laser focus along the writing path in the protein precursor material. Diameter and height of volume elements, so-called voxel, in a free space become ellipsoidal shapes due to mismatch between focused spot sizes and Rayleigh length, as indicated by dashed and solid lines. On the substrate, surface bound structures are formed, depending on the position of focus. Determining resolution as the smallest distance between distinguishable structures, well-connected 3D structures can be formed by scanning the focused laser beam with a step smaller than the resolution. The box inset shows that protein molecules (light blue) in the precursor are interacted with photoactivator (orange) to be cross-linked (dark blue). The circular inset shows an SEM image of an icosahedron with submicron feature sizes, scale bar represents 1 μm, reprinted from ref. 33, with the permission of AIP Publishing, copyright 2015.
    PDB data overview.Properties of 16 different protein structures obtained from selected PDB files: (a) the secondary structures, (b) unique chains, (c) chain lengths, (d) unit weights, and (e)–(f) amino acid distributions. (e) Single letter amino acid codes sorted by classification according to Livingstone et al. from ref. 74. (f) The distributions of amino acid occurrence in the PDB FASTA sequence for 16 proteins versus respective database values, calculated from reports by Eitner et al. from ref. 75.
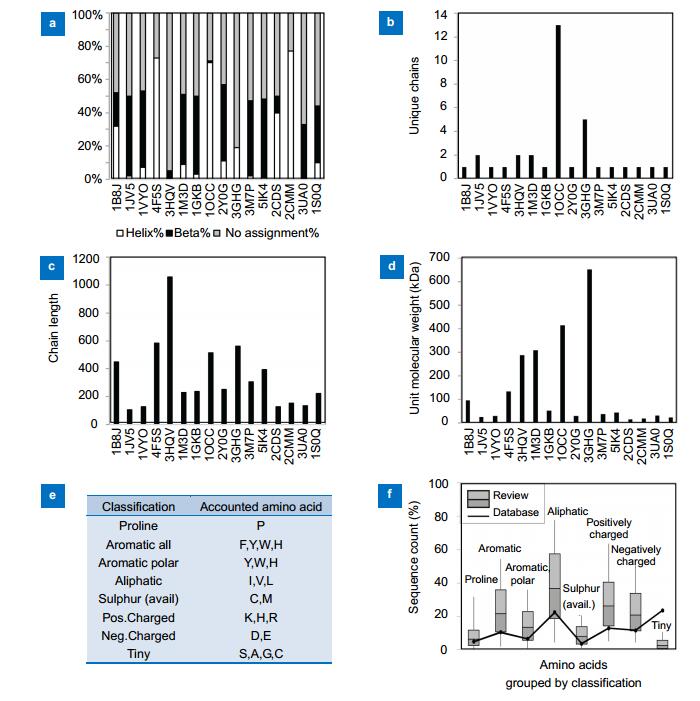
    Fig. 2. PDB data overview.Properties of 16 different protein structures obtained from selected PDB files: (a) the secondary structures, (b) unique chains, (c) chain lengths, (d) unit weights, and (e)–(f) amino acid distributions. (e) Single letter amino acid codes sorted by classification according to Livingstone et al. from ref. 74. (f) The distributions of amino acid occurrence in the PDB FASTA sequence for 16 proteins versus respective database values, calculated from reports by Eitner et al. from ref. 75.
    Proposed processes for protein cross-linking and adherence.A schematic illustration depicting the differing degrees of deformation and adhesion that can degenerate protein functionality. Specific surfaces render the functional domain inaccessible or can have little effect on the native protein, leading to retained protein function. Figure reprinted with permission from supplementary material of ref. 43, copyright 2017, American Chemical Society.
    Fig. 3. Proposed processes for protein cross-linking and adherence.A schematic illustration depicting the differing degrees of deformation and adhesion that can degenerate protein functionality. Specific surfaces render the functional domain inaccessible or can have little effect on the native protein, leading to retained protein function. Figure reprinted with permission from supplementary material of ref. 43, copyright 2017, American Chemical Society.
    Proposed free radical mechanisms.Three selected protein cross-linking fabrication mechanisms based on radical oxygen formation inside the protein from (a) ref. 26, (b) ref. 32, and (c) ref. 28 are matched the four stages of light-induced radical chain reaction: excitation, radical generation, propagation and termination. Tyr represents tyrosine and M represents DNA-bound metal.
    Fig. 4. Proposed free radical mechanisms.Three selected protein cross-linking fabrication mechanisms based on radical oxygen formation inside the protein from (a) ref. 26, (b) ref. 32, and (c) ref. 28 are matched the four stages of light-induced radical chain reaction: excitation, radical generation, propagation and termination. Tyr represents tyrosine and M represents DNA-bound metal.
    pH actuation.(a) Conceptual drawing of the fabrication of a device with regions having varying swelling properties in a protein solution in response to the same laser exposure. (b) Lay et al. designed a mesh pattern in which the porosity changes with pH. (c) pH-actuation of a microgripper, in which each pillar is approximately 5 µm wide at the base. (d) Dependence of the focal distance of a pH-tunable lens on pH.(a, b) Reprinted with permission from ref. 62, copyright 2015, American Chemical Society. (c) Reprinted with permission from ref. 40, copyright 2015, John Wiley and Sons. (d) Reprinted with permission from ref. 55, copyright 2015, John Wiley and Sons.
    Fig. 5. pH actuation.(a) Conceptual drawing of the fabrication of a device with regions having varying swelling properties in a protein solution in response to the same laser exposure. (b) Lay et al. designed a mesh pattern in which the porosity changes with pH. (c) pH-actuation of a microgripper, in which each pillar is approximately 5 µm wide at the base. (d) Dependence of the focal distance of a pH-tunable lens on pH. (a, b) Reprinted with permission from ref. 62, copyright 2015, American Chemical Society. (c) Reprinted with permission from ref. 40, copyright 2015, John Wiley and Sons. (d) Reprinted with permission from ref. 55, copyright 2015, John Wiley and Sons.
    Soft microoptics.(a) A schematic illustration of the repetitive bending of KPL made of protein formed on a PDMS sheet (upper), and light diffraction results at different positions along the main light axis (lower). (b) A stimulus-responsive whispering-gallery-mode micro-laser fabricated from BSA. This structure requires high accuracy in fabrication and performs in air (shown) and aqueous environments. (a) Adapted by permission from Springer Nature: Light Sci. Appl.41, copyright 2014. (b) Adapted by permission from Springer Nature: Sci. Rep.53, copyright 2015.
    Fig. 6. Soft microoptics.(a) A schematic illustration of the repetitive bending of KPL made of protein formed on a PDMS sheet (upper), and light diffraction results at different positions along the main light axis (lower). (b) A stimulus-responsive whispering-gallery-mode micro-laser fabricated from BSA. This structure requires high accuracy in fabrication and performs in air (shown) and aqueous environments. (a) Adapted by permission from Springer Nature: Light Sci. Appl.41, copyright 2014. (b) Adapted by permission from Springer Nature: Sci. Rep.53, copyright 2015.
    Cell culture scaffold andin situguidance.(a) A two-protein microscaffold made with fibronectin and BSA to selectively cultivate cells only on the fibronecting elements. (b) Proteinaceous networks embedded in a mechanically supportive polymer scaffold to provide a microenvironment. (c) In situ observation of a captured bacterial cell with a fluorescent marker. The encapsulated bacterial cell had access to a nutritional medium and multiplied while trapped (scale bar represents 10 μm). (d) In situ guiding of neuronal cells by directly writing free lines (indicated by white arrows) near the cellular extensions (scale bar represents 10 μm). (a) Reprinted with permission from ref. 59, copyright 2015, OSA Publishing. (b) Reprinted with permission from ref. 43, copyright 2017, American Chemical Society. (c) Adapted with permission from ref. 57, copyright 2012, American Chemical Society. (d) Reprinted with permission from ref. 56, copyright 2004, National Academy of Sciences.
    Fig. 7. Cell culture scaffold and in situ guidance.(a) A two-protein microscaffold made with fibronectin and BSA to selectively cultivate cells only on the fibronecting elements. (b) Proteinaceous networks embedded in a mechanically supportive polymer scaffold to provide a microenvironment. (c) In situ observation of a captured bacterial cell with a fluorescent marker. The encapsulated bacterial cell had access to a nutritional medium and multiplied while trapped (scale bar represents 10 μm). (d) In situ guiding of neuronal cells by directly writing free lines (indicated by white arrows) near the cellular extensions (scale bar represents 10 μm). (a) Reprinted with permission from ref. 59, copyright 2015, OSA Publishing. (b) Reprinted with permission from ref. 43, copyright 2017, American Chemical Society. (c) Adapted with permission from ref. 57, copyright 2012, American Chemical Society. (d) Reprinted with permission from ref. 56, copyright 2004, National Academy of Sciences.
    Microfluidic integration.Proteinaceous structures integrated into (a), (b) polydimethylsiloxane (PDMS) and (c) glass microfluidic devices. (a) Live capture of red blood cells (RBCs) based on type A binding to an anti-A antibody protein pad. (b) Enzyme reactors made from trypsin integrated into a PDMS channel. (c) Integration of BSA microstructures (top view during fabrication with 25 μm scale bar and SEM perspective view with 10 μm scale bar) and an EGFP pattern and BSA pattern in a closed glass microfluidic channel with 100 μm scale bars.(a) Reprinted by permission from the authors and SPIE 35, copyright 2015. (b) Adapted by permission from Springer Nature: Microfluids and Nanofluids 36, copyright 2011. (c) Adapted with permission from ref. 37, copyright 2018 MDPI.
    Fig. 8. Microfluidic integration.Proteinaceous structures integrated into (a), (b) polydimethylsiloxane (PDMS) and (c) glass microfluidic devices. (a) Live capture of red blood cells (RBCs) based on type A binding to an anti-A antibody protein pad. (b) Enzyme reactors made from trypsin integrated into a PDMS channel. (c) Integration of BSA microstructures (top view during fabrication with 25 μm scale bar and SEM perspective view with 10 μm scale bar) and an EGFP pattern and BSA pattern in a closed glass microfluidic channel with 100 μm scale bars. (a) Reprinted by permission from the authors and SPIE 35, copyright 2015. (b) Adapted by permission from Springer Nature: Microfluids and Nanofluids 36, copyright 2011. (c) Adapted with permission from ref. 37, copyright 2018 MDPI.
    Representative PDB codeProtein (mg/mL)Photoactivator (mM)SolventReferences
    1B8JAlkaline phosphatase (AP)280-350, 9800, 2100RB0.25Ascorbic acid (1 mM)38
    AP-BSA38 , 32
    1JV5Antibody anti-An.a.Eosin-Y0.3n.a.35
    1VYOAvidin50-400FMN, FAD, MB, RB0, 1.2-8.5Distilled water or buffer(PBS or HEPES), pH ~7.439 , 45 - 49
    Eosin-Y, MB14.3, 4.3DMSO 21% in HEPES buffer34
    FAD with RhB0.250 with 0.40712.5% HEPES, 19% DMSO, organic solvents43
    4F5SBovine serum albumin (BSA)50-600, 800-1000 53Eosin-Y, Texas-Red, RhB, MBS, R6G, BPD, RB, FMN, FAD, MB0-100Distilled water or buffer (PBS or HEPES), pH ~7.3-432 , 35 , 37 , 39 , 41 - 42 , 44 - 61
    210-460Eosin-Y, MB, RB, RhB with FAD4-14.3, 0.3-0.6 with 0.2518%-23% DMSO in HEPES buffer (organic solvent)34 , 40 , 43 , 62 - 63 , 66
    0-200FAD, Benzophenone- biotin0-2, 3-2250% DMSO in buffer33 , 64
    100, 200MBS67-10050%wt glycerol-water37
    Biotinylated BSA (b-BSA)100-300FMN, FAD1-5Buffer (PBS or HEPES, pH ~7.4)48 , 61
    BSA conjugated with dye (dye-BSA)200-400RB, MB0, 0.25, 5Acetic or buffer, pH ~7.3-438 , 48 , 58 , 65
    3HQVCollagen type-Ⅰ(Col.Ⅰ)15, 30, 45FMN0.6, 1.2, 1.8Acetic acid, aqueous67
    Collagen type-Ⅰ, Ⅱ, or Ⅳ (Col.Ⅰ, Col.Ⅱ, Col.Ⅳ)2-3BPD, RB0.2, 1Acetic acid, aqueous52
    1M3DCol.Ⅳ - BSA0.15, 25FAD with RhB0.125 with 0.3mixed DMSO, HEPES buffer, organic solventAs purchased (pH=5)43 , 66
    1GKBConcanavalinA (ConA)4.5RB, Texas-red, RhB0.5n.a.69
    1OCCCytochrome c (CytC)100, 200FAD0, 4.5, 10Supporting electrolyte, pH=7.40.46 , 49 , 68
    2Y0GEnhanced green fluorescent protein (EGFP)2.35MBS10HEPES-KOH buffer, pH = 7.437
    3GHGFibrinogen (FNG)3.9 or as purchasedRB, Texas-red, RhB0.01-0.1As purchased32 , 69
    3M7PFibronectin (FN)1-1.29RB, Texas-red, RhB2-4Distilled water44 , 59 , 69
    2CMMMyoglobin (MGN)40RB, MB8.5 or 5HEPES buffer (pH 7.4)47
    5IK4Laminin (LN) mixed with BSAn.a.FAD, MB1-4, 0.25HEPES buffer (pH 7.4)56
    2CDSLysozyme (Lys)300-400MB, FAD1.2-5HEPES buffer (pH 7.4)45 , 47
    320-400Eosin-Y, FAD, MB4.3-14.3DMSO 21%, HEPES buffer34 , 39
    3UA0Regenerated silk fibroin (RSF)25MB5Aqueous, pH=7.070
    1S0QTrypsin (TR)20FAD, Eosin-Y6, 0.3n.a.36
    Table 1. Protein solution conditions. A summary of previous fabrication conditions, focusing on protein and photosensitizer concentrations. Examples of typical solvents and protein databank samples are included. Photoactivator abbreviations: rose bengal (RB), methylene blue (MB), flavin mononucleotide (FMN), flavin dinucleotide (FAD), rhodamine B (RhB), rhodamine 6 G (R6G), benzophenone dimer (BPD), sodium 4-[2-(4-morpholino)benzoyl-2-dimethylamino]butylbenzenesulfonate (MBS). Solvent abbreviations are: dimethyl sulfoxide (DMSO), phosphate-buffered saline (PBS), 4-(2-hydroxyethyl)-1-piperazineethanesulfonic acid (HEPES).
    DevicePulse widthFrequencyWavelength (nm)Fabrication conditionsSpecial setupsFeature sizeProteinReferences
    fsOscillator(Ti:Sa primarily)< 29 fs, 100–120 fs, 400 fs54 MHz, 75 MHz, 76 MHz, 80 MHz, 82 MHz525, 715, 740, 750, 780, 800, 806, 85020–123 mW, 3.385-6.093 mW, 0.5–7 µm/s, correcteddose equivalent K_L:0.01–100, 100–500pJ/pulse, single spot 1ms, 30–87 mW/μm 21 μm at780 nm, 1.5 μmat 850nmBSA, RSF, FN, CytC, TR, Avidin, b-BSA, AP, BSA-AP, dye-BSA, Col.Ⅰ, Col.Ⅱ, Col.Ⅳ36 - 38 , 42 , 44 - 45 , 48 , 50 , 52 , 55 , 59 , 61 , 68 - 70
    100 fs, 120 fs76 MHz, 80 MHz740, 8001.6 µs/pixel, 120 mW, exposure doses 0–1.2 10 8 mJ/cm 2 , 1000 μs/ 100 nm/20–40 mW, 24–66 mW/μm 2galvano scan200 nmBSA, FNG, FN, ConA, AP, Avidin, CytC32 , 41 , 46 , 51 , 53
    60 fs, < 200 fs76 MHz, 80 MHz730–740, 7505–105 mW, raster scan velocity of approx. 7 mm/s and a slow-axis velocity of 5–6 μm/sDMDsubmicron(0.5 μm)BSA, dye-BSA, Avidin, Lys, MGN34 , 39 , 47 , 57 - 58 , 60 , 64
    Fiber94 fs, 100–200fs, 140 fs, 360 fs200 kHz, 79.8-80 MHz522, 740, 780, 7900.09–144 mW, 0.2–10µm/s, 30 µm/s, 70µm/s, 2.4–9.1 nJ/µm2 energy densityfeature sizes > 250 nm, > 150 nmBSA, BSA/LN, Col.Ⅰ, Col.Ⅳ, Avidin, EGFP33 , 37 , 40 , 43 , 56 , 62 - 63 , 66 , 67
    ps(subns)Frequencydoubled μ-chip550 ps7 kHz532Corrected dose equivalent K_L:0.01–100BSA44
    Diodepumped Q-switched800 ps, 600 ps8 kHz, 7 kHz532Scanning up to 50μm/s, 277–321 GW cm −2 peak, pulse E 3.5 µJ, 0.5–6 mW140 nm(surface bound line)BSA, CytC48 , 49
    Microlaser500 ps6.5 kHz, 40 kHz53215, 20, 40 mW, 5 µm/s, 0.15 mW of laser power and 1 ms exposure timeBSA, TR, anti-A antibody35 , 36 , 50
    nsQ-switched solid state12 ns20 kHz5321 mW, 62 mW, 2–8 fpsSLMBSA, dye-BSA54 , 65
    Table 2. Laser fabrication conditions. Fabrication sorted by pulse width: femtosecond (fs), picosecond (ps) and nanosecond (ns). For almost all reports, high-NA lenses were used. BSA was employed for all conditions. Dynamic mirror device (DMD), spatial light modulator (SLM), or galvano mirrors were used in some of these previous works.
    Daniela Serien, Koji Sugioka. Fabrication of three-dimensional proteinaceous micro- and nano-structures by femtosecond laser cross-linking[J]. Opto-Electronic Advances, 2018, 1(4): 180008-1
    Download Citation