
Xuping Zhang, Xiaohong Chen, Lei Liang, Shisong Zhao, Rulong He, Shuai Tong, Feng Wang, Ningmu Zou, Yixin Zhang. Enhanced C-OTDR-Based Online Monitoring Scheme for Long-Distance Submarine Cables[J]. Acta Optica Sinica, 2021, 41(13): 1306001
- Acta Optica Sinica
- Vol. 41, Issue 13, 1306001 (2021)
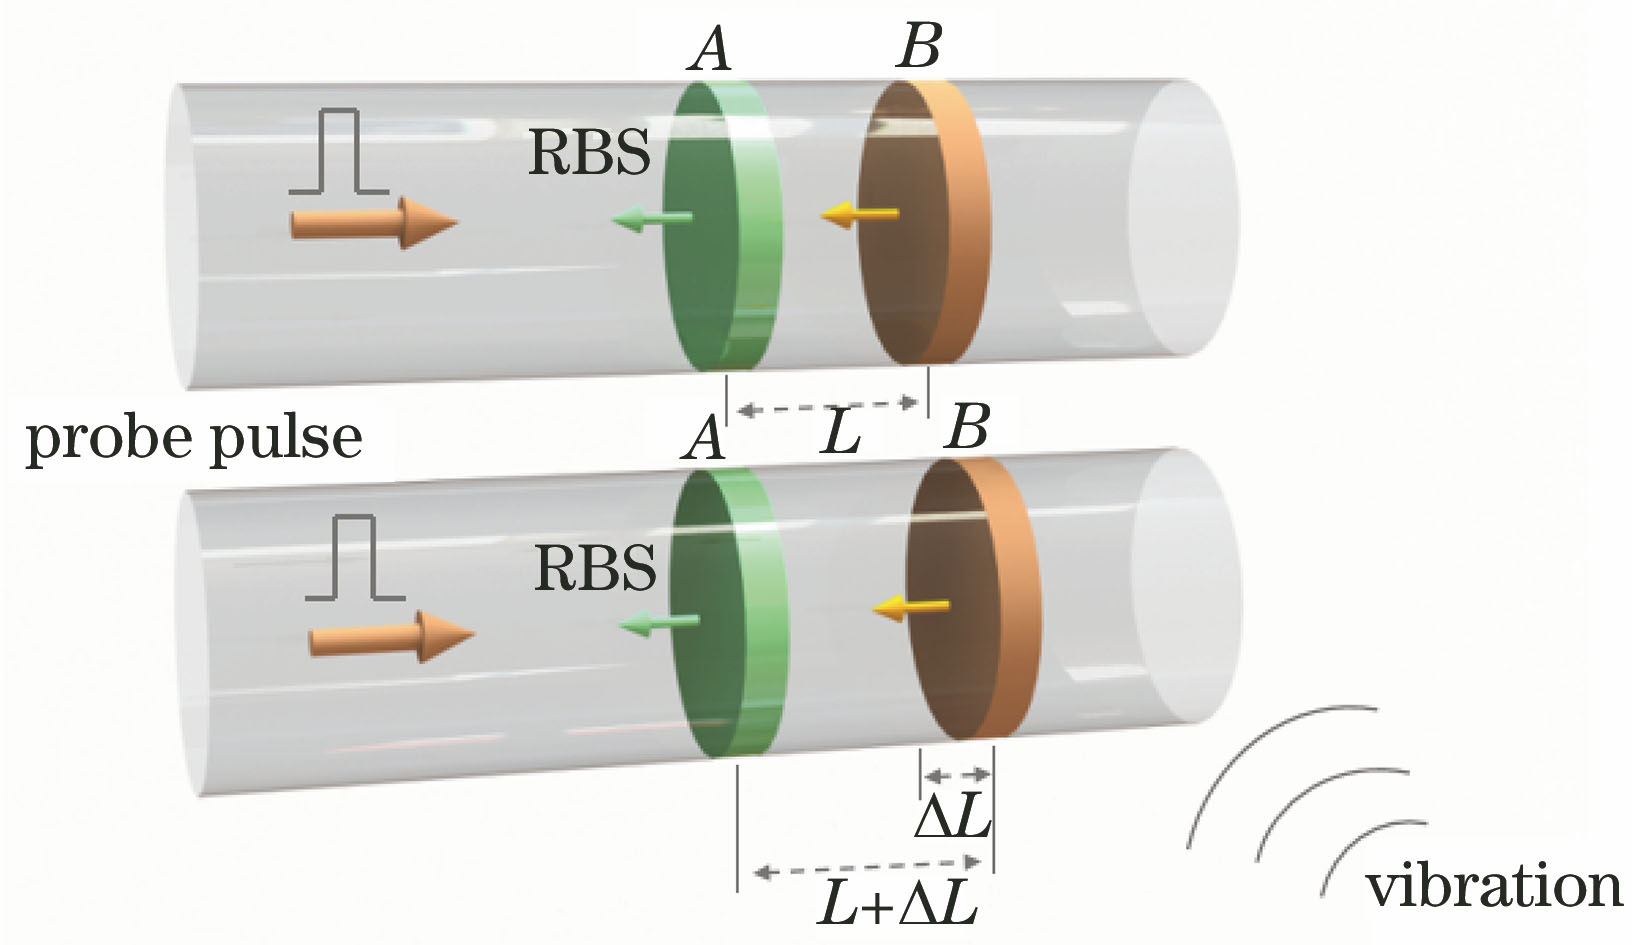
Fig. 1. Diagram of optical fiber deformation caused by external vibration
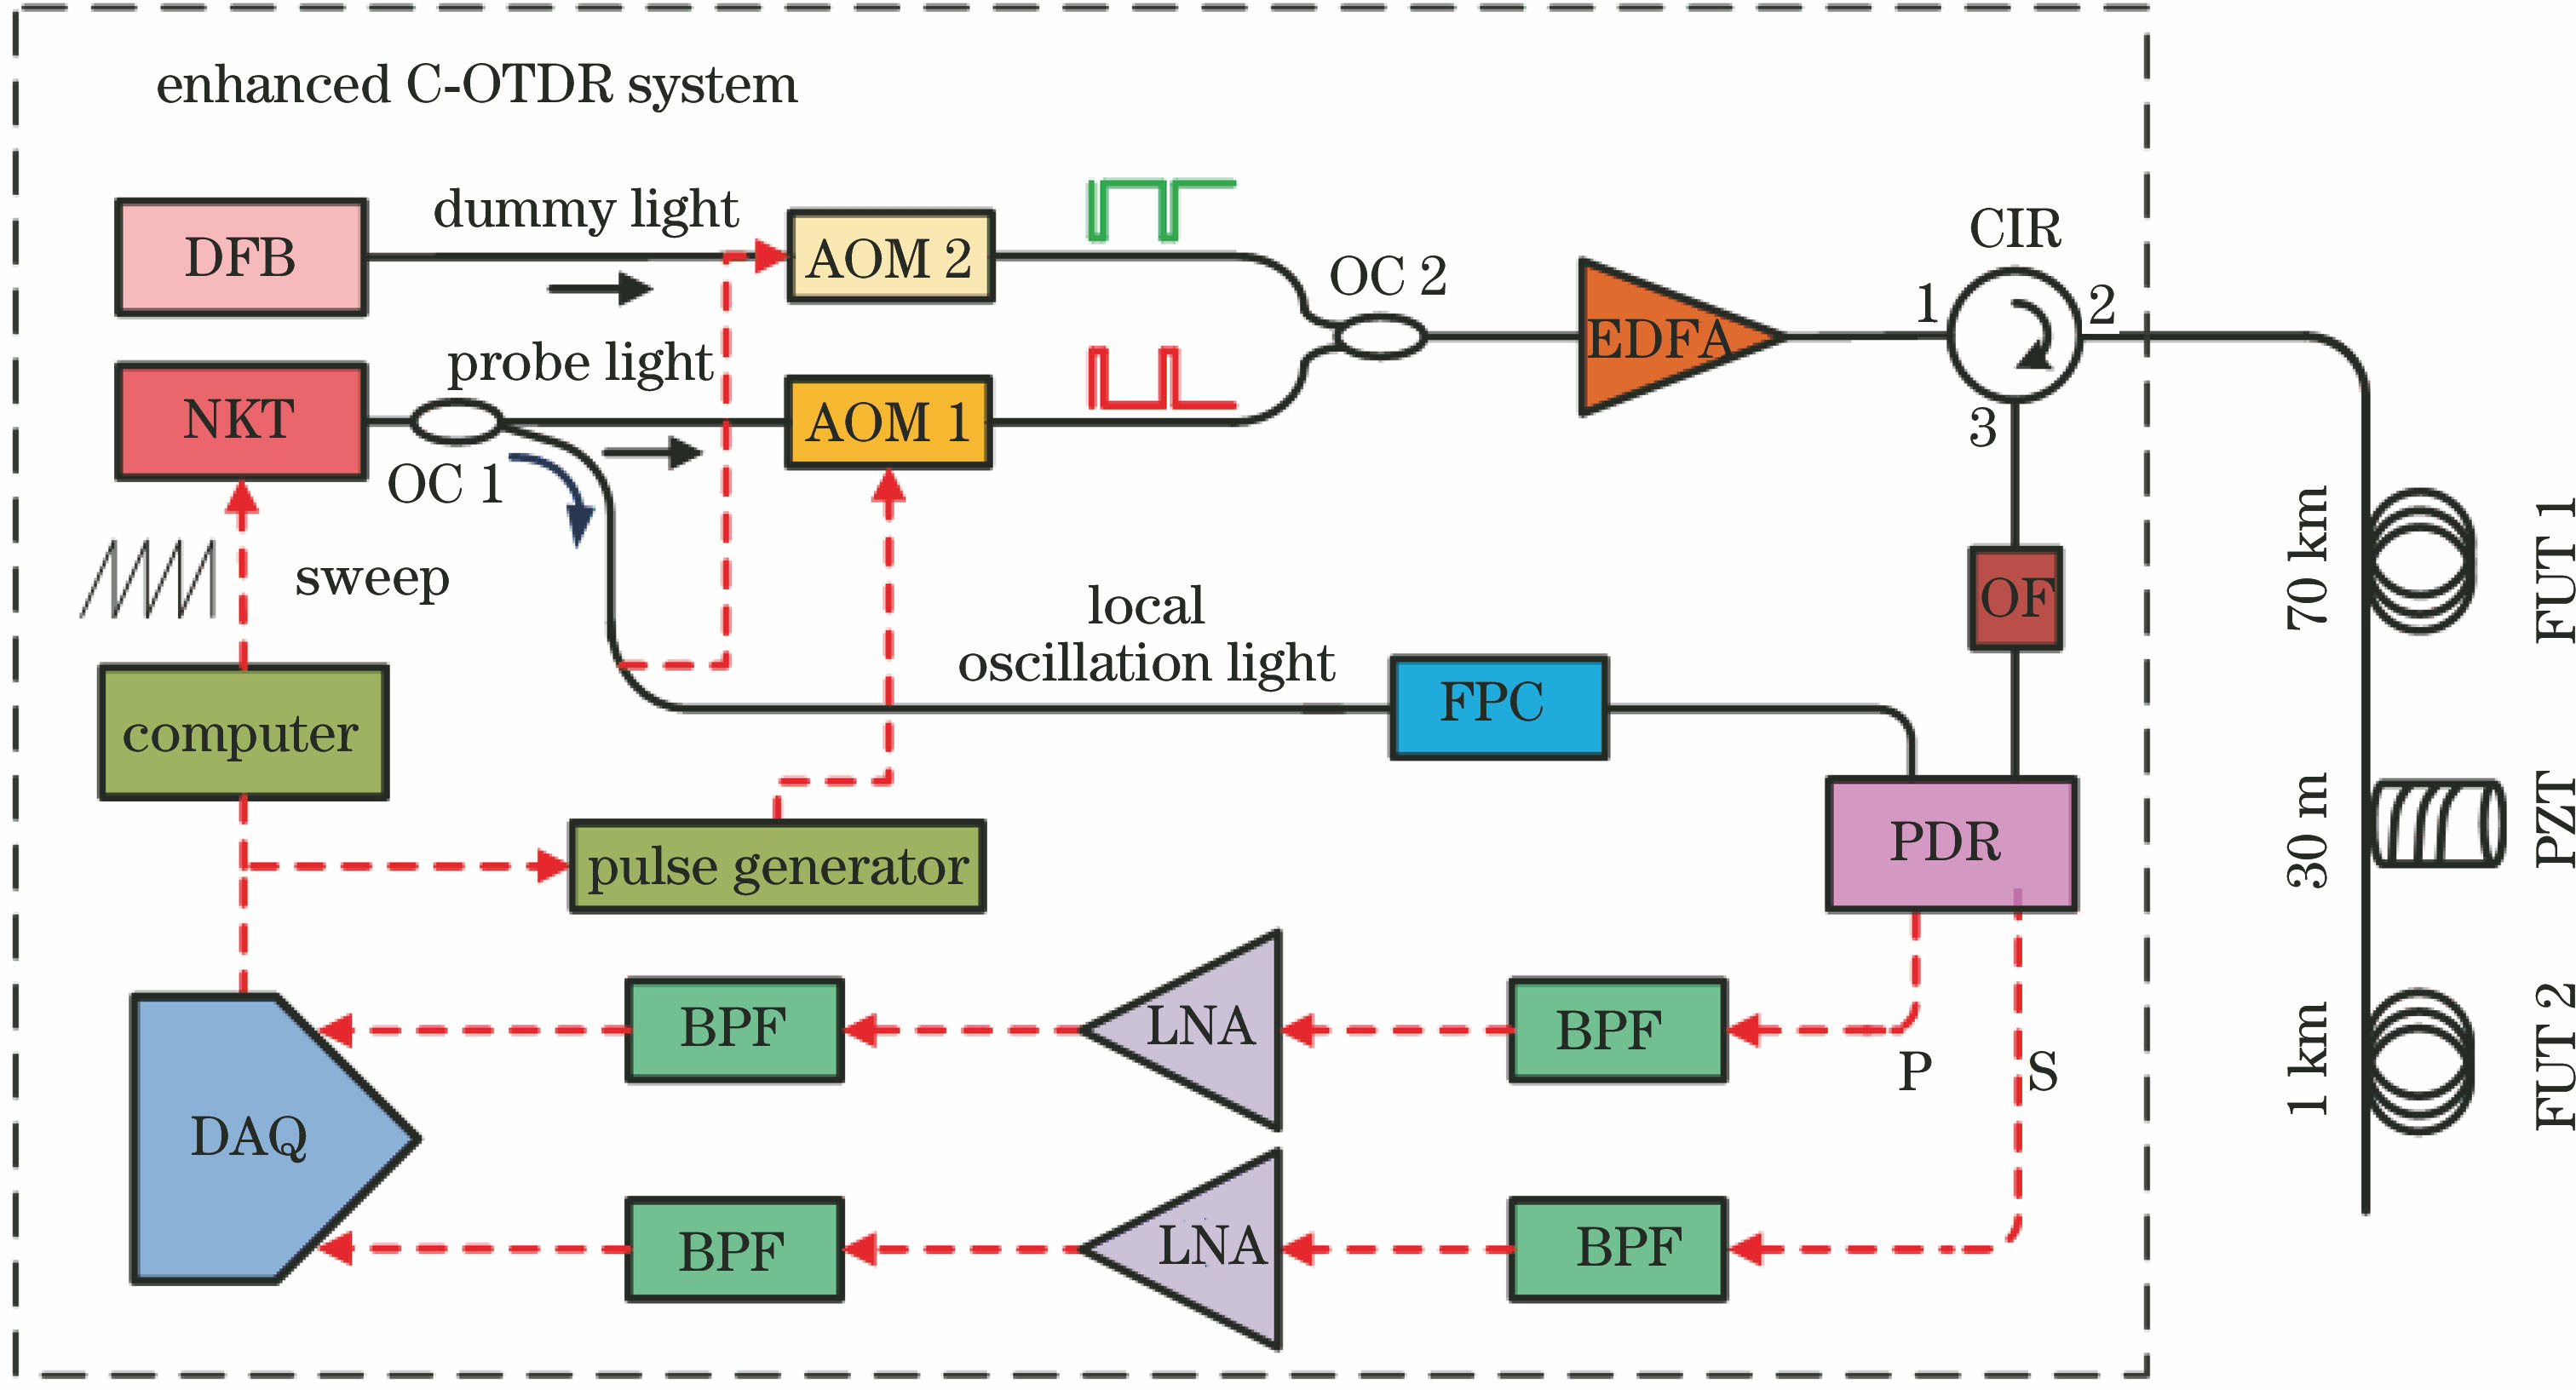
Fig. 2. Improved C-OTDR structure
Fig. 3. Waveforms of intermediate frequency signals in P state and S state
Fig. 4. Process flow of optimal selection algorithm of polarization diversity amplitude
Fig. 5. Loss test results of 216 curves under different polarization states. (a) P state; (b) S state; (c) two states accumulation
Fig. 6. Partial enlargement of Fig. 5 . (a) P state; (b) S state; (c) two states accumulation
Fig. 7. Signal amplitude waterfall near PZT in P polarization state
Fig. 8. Phase information extracted from two polarization states and reconstruction results after optimization. (a) Phase extraction result of P polarization state; (b) phase extraction result of S polarization state; (c) amplitude sum before and after perturbation position; (d) optimal result; (e) reconstructed signal after processing by optimal selection algorithm of polarization diversity amplitude
Fig. 9. Temporal and spatial amplitude waterfall diagram of water pump spraying process
Fig. 10. Vibration waveform of water impacting optical cable
Fig. 11. Temporal and spatial amplitude waterfall diagram obtained from anchor damage simulation test
Fig. 12. Time domain waveform of vibration signal measured by anchor damage simulation
Fig. 13. Schematic of two-terminal cooperation of marine cable monitoring system
|
Table 1. Performance comparison of long distance C-OTDR and Φ-OTDR sensing systems

Set citation alerts for the article
Please enter your email address
© Copyright 2018-2021 | Chinese Laser Press. All Rights Reserved 沪ICP备15018463号-20