• Photonics Research
  • Vol. 8, Issue 7, 1110 (2020)
Rongqiao Wan1, Xiang Gao1, Liancheng Wang1、2、5、*, Shuo Zhang2、3, Xiongbin Chen4, Zhiqiang Liu2、3, Xiaoyan Yi2、3、6、*, Junxi Wang2、3, Junhui Li1, Wenhui Zhu1, and Jinmin Li2、3
Author Affiliations
  • 1State Key Laboratory of High Performance Complex Manufacturing, College of Mechanical and Electrical Engineering, Central South University, Changsha 410083, China
  • 2Semiconductor Lighting Technology Research and Development Center, Institute of Semiconductors, Chinese Academy of Sciences, Beijing 100083, China
  • 3College of Materials Science and Opto-Electronic Technology, University of Chinese Academy of Sciences, Beijing 101408, China
  • 4State Key Laboratory of Integrated Optoelectronics, Institute of Semiconductors, Chinese Academy of Sciences, Beijing 100083, China
  • 5e-mail: liancheng_wang@csu.edu.cn
  • 6e-mail: spring@semi.ac.cn
  • show less
    DOI: 10.1364/PRJ.392046 Cite this Article Set citation alerts
    Rongqiao Wan, Xiang Gao, Liancheng Wang, Shuo Zhang, Xiongbin Chen, Zhiqiang Liu, Xiaoyan Yi, Junxi Wang, Junhui Li, Wenhui Zhu, Jinmin Li. Phosphor-free single chip GaN-based white light emitting diodes with a moderate color rendering index and significantly enhanced communications bandwidth[J]. Photonics Research, 2020, 8(7): 1110 Copy Citation Text show less
    (a) Schematic epitaxial structure. (b) HRTEM image of the QWs. (c) ω-2θ scan of the epitaxial layer. (d) ω-scan rocking curves of (0002) and (10-12) planes.
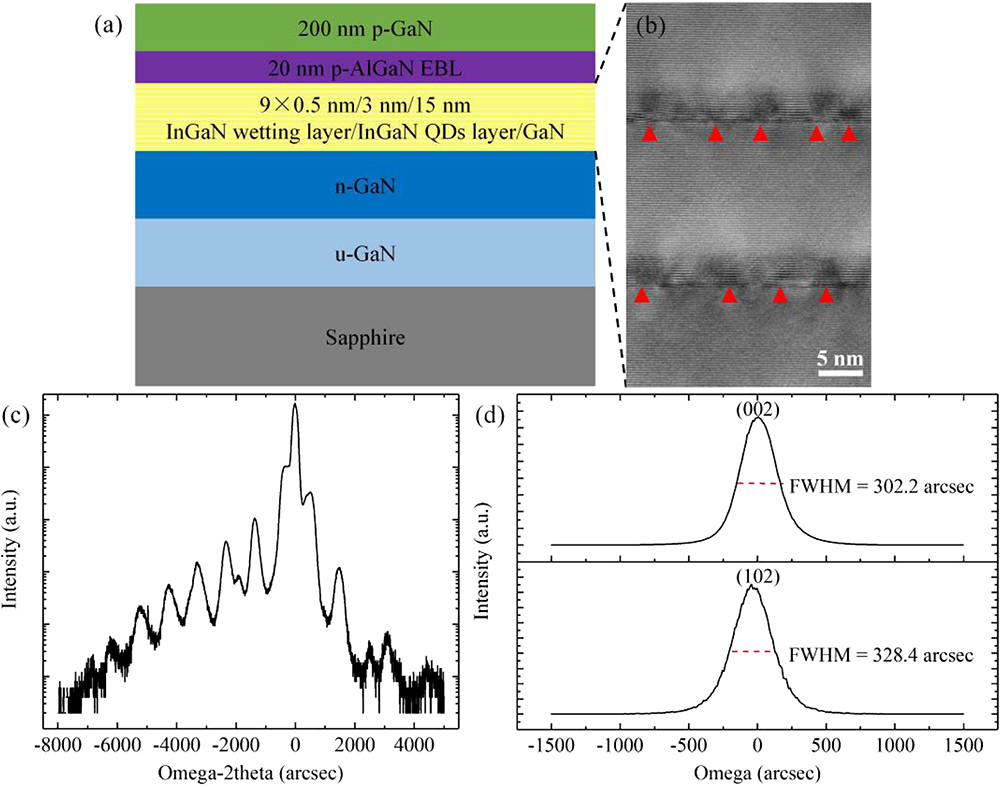
    Fig. 1. (a) Schematic epitaxial structure. (b) HRTEM image of the QWs. (c) ω-2θ scan of the epitaxial layer. (d) ω-scan rocking curves of (0002) and (10-12) planes.
    (a) TDPL spectra of the InGaN QDs sample. (b) Peak wavelength and FWHM of TDPL spectra versus measurement temperatures. (c) PL decay curve of the InGaN QDs sample at 300 K.
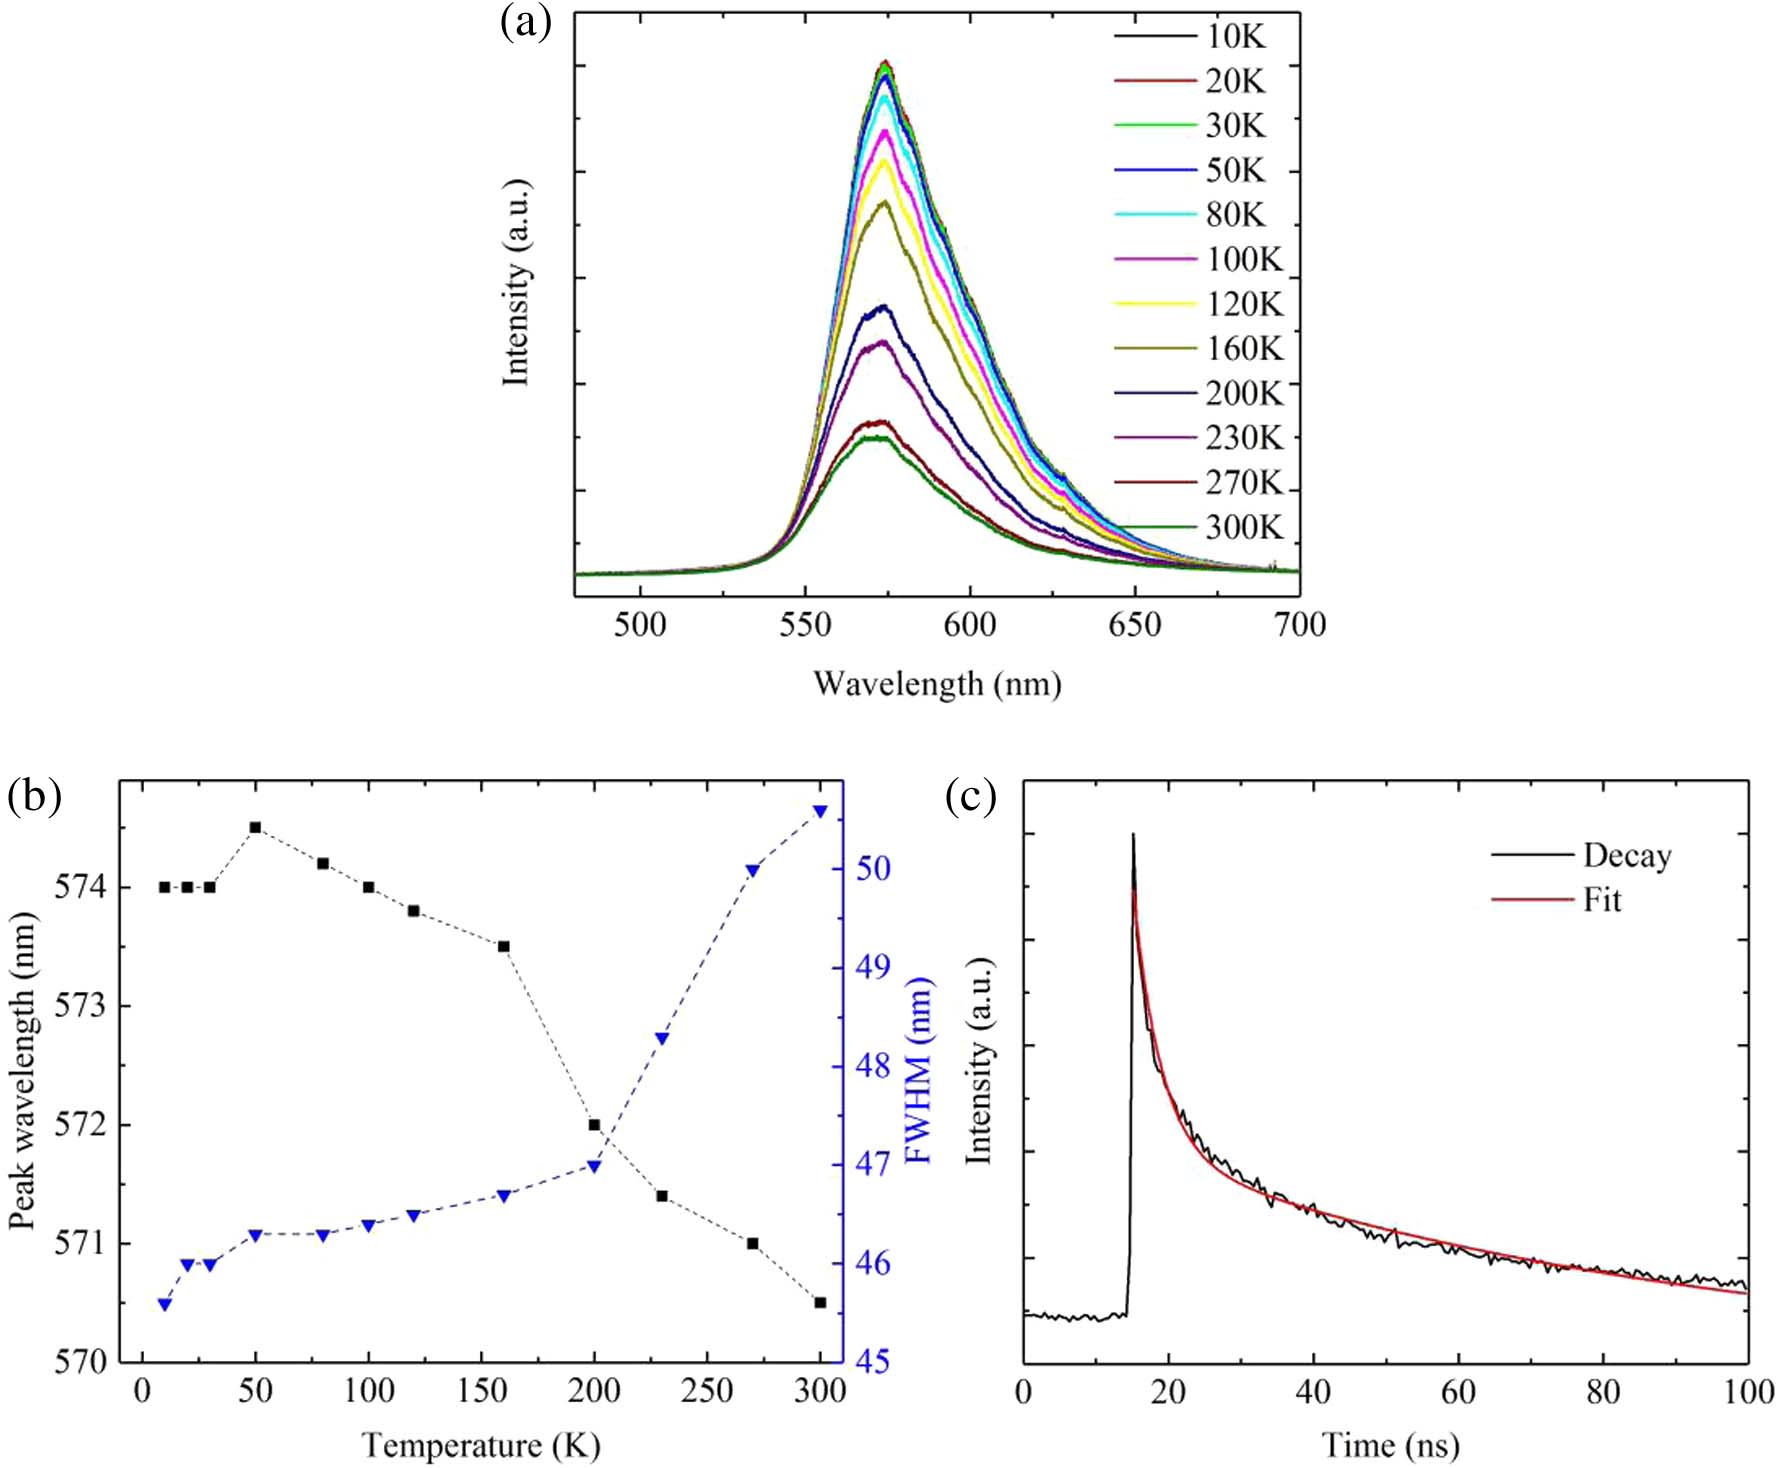
    Fig. 2. (a) TDPL spectra of the InGaN QDs sample. (b) Peak wavelength and FWHM of TDPL spectra versus measurement temperatures. (c) PL decay curve of the InGaN QDs sample at 300 K.
    (a) Voltage-current and optical power-current characteristics of InGaN QDs LEDs. (b) EL spectra of the InGaN QDs LEDs with injection current varying. (c) The change of red, green, and blue peaks’ position with injection current varying. (d) Intensity ratio in red, green, and blue peaks versus injection current. (e) EL images of InGaN QDs LEDs at injection currents of 5, 10, 20, 100, and 150 mA.
    Fig. 3. (a) Voltage-current and optical power-current characteristics of InGaN QDs LEDs. (b) EL spectra of the InGaN QDs LEDs with injection current varying. (c) The change of red, green, and blue peaks’ position with injection current varying. (d) Intensity ratio in red, green, and blue peaks versus injection current. (e) EL images of InGaN QDs LEDs at injection currents of 5, 10, 20, 100, and 150 mA.
    Schematic illustration of the carrier recombination mechanism of InGaN QDs based single chip WLED.
    Fig. 4. Schematic illustration of the carrier recombination mechanism of InGaN QDs based single chip WLED.
    (a) CIE-1931 chromaticity coordinates. (b) CCT and CRI of single chip WLED versus injection current.
    Fig. 5. (a) CIE-1931 chromaticity coordinates. (b) CCT and CRI of single chip WLED versus injection current.
    (a) The frequency response and (b) bandwidth of single chip WLED versus injection current density. (c) EL spectra of the single chip WLED at 72 A/cm2 (90 mA), with the corresponding EL image in the inset.
    Fig. 6. (a) The frequency response and (b) bandwidth of single chip WLED versus injection current density. (c) EL spectra of the single chip WLED at 72  A/cm2 (90 mA), with the corresponding EL image in the inset.
    (a) The BER and (b) eye diagram versus the data rate of single chip WLED at 72 A/cm2 (90 mA).
    Fig. 7. (a) The BER and (b) eye diagram versus the data rate of single chip WLED at 72  A/cm2 (90 mA).
    λ (nm)Current DensityConversion MaterialCCT (K)CRIBandwidth (MHz)Refs.
    4451.1  kA/cm2Perovskite QDs85[11]
    47020  kA/cm2CdSe/ZnS QDs10,000637.6[15]
    460CdSe/ZnS QDs9.8[7]
    460Phosphor3.6[7]
    450AgInS2/ZnS QDs855.4[32]
    4864.59  kA/cm2Phosphor127.3[33]
    400–7500.07  kA/cm2No phosphor625372150This work
    Table 1. Comparison of the Characteristics of GaN-Based WLEDs
    Rongqiao Wan, Xiang Gao, Liancheng Wang, Shuo Zhang, Xiongbin Chen, Zhiqiang Liu, Xiaoyan Yi, Junxi Wang, Junhui Li, Wenhui Zhu, Jinmin Li. Phosphor-free single chip GaN-based white light emitting diodes with a moderate color rendering index and significantly enhanced communications bandwidth[J]. Photonics Research, 2020, 8(7): 1110
    Download Citation