• Photonics Research
  • Vol. 9, Issue 6, 899 (2021)
Sandeep Kumar Kalva1、2, Xose Luis Dean-Ben1、2, and Daniel Razansky1、2、*
Author Affiliations
  • 1Institute of Pharmacology and Toxicology and Institute for Biomedical Engineering, Faculty of Medicine, University of Zurich, Zurich, Switzerland
  • 2Institute for Biomedical Engineering, Department of Information Technology and Electrical Engineering, ETH Zurich, Zurich, Switzerland
  • show less
    DOI: 10.1364/PRJ.418591 Cite this Article Set citation alerts
    Sandeep Kumar Kalva, Xose Luis Dean-Ben, Daniel Razansky. Single-sweep volumetric optoacoustic tomography of whole mice[J]. Photonics Research, 2021, 9(6): 899 Copy Citation Text show less
    Single-sweep volumetric optoacoustic tomography (sSVOT) system characterization. (a) Schematic of the sSVOT scanner showing the difference between the single-beam illumination based (left) and multibeam illumination (right) approach. SA, spherical array; FB, fiber bundle; and OA, optoacoustic. (b) Simulated light distribution models for single-beam illumination (left) and multibeam illumination (right). (c) Maximum intensity projections (MIPs) across cross-sectional view demonstrating the spheres using single-beam (top left) and multibeam illumination (top right) approaches at single position of the spherical array. The corresponding fluence corrected images are shown at the bottom row. Arrows point to the spheres that appeared after the fluence correction. (d) Characterization of the reconstructed microsphere size in the central imaging plane along the radial (er) and azimuthal (eϕ) directions. Scale bar: 1 cm.
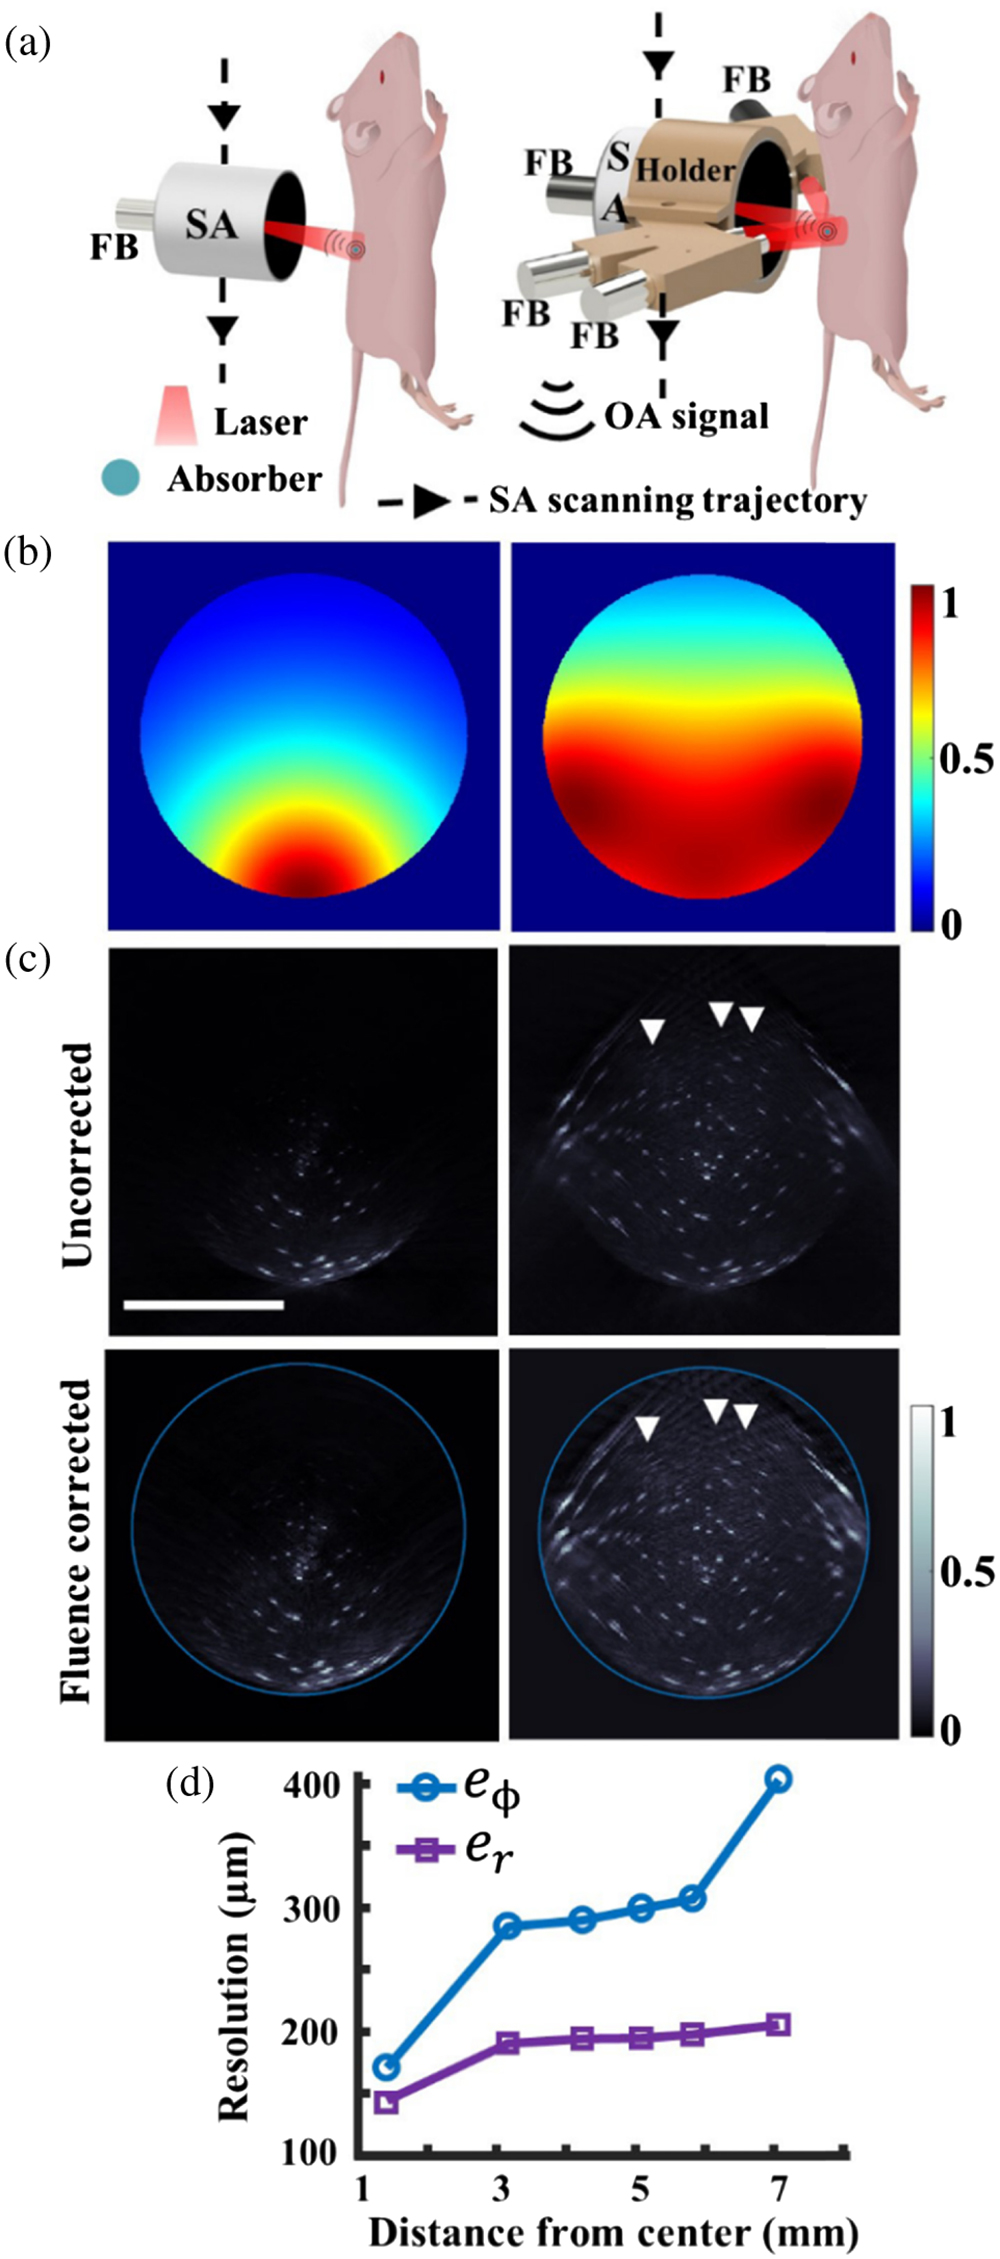
    Fig. 1. Single-sweep volumetric optoacoustic tomography (sSVOT) system characterization. (a) Schematic of the sSVOT scanner showing the difference between the single-beam illumination based (left) and multibeam illumination (right) approach. SA, spherical array; FB, fiber bundle; and OA, optoacoustic. (b) Simulated light distribution models for single-beam illumination (left) and multibeam illumination (right). (c) Maximum intensity projections (MIPs) across cross-sectional view demonstrating the spheres using single-beam (top left) and multibeam illumination (top right) approaches at single position of the spherical array. The corresponding fluence corrected images are shown at the bottom row. Arrows point to the spheres that appeared after the fluence correction. (d) Characterization of the reconstructed microsphere size in the central imaging plane along the radial (er) and azimuthal (eϕ) directions. Scale bar: 1 cm.
    In vivo comparison study between the single-beam and multibeam illumination approaches. (a) Images reconstructed after single vertical sweeps using single-beam (left) and multibeam (right) illuminations. (b) Fluence corrected cross-sectional reconstructions (MIPs over 1 mm thickness) at several anatomical positions along the animal: (left) using single-beam and (right) using multibeam illumination. Arrows point to the differences. Scale bar: 1 cm.
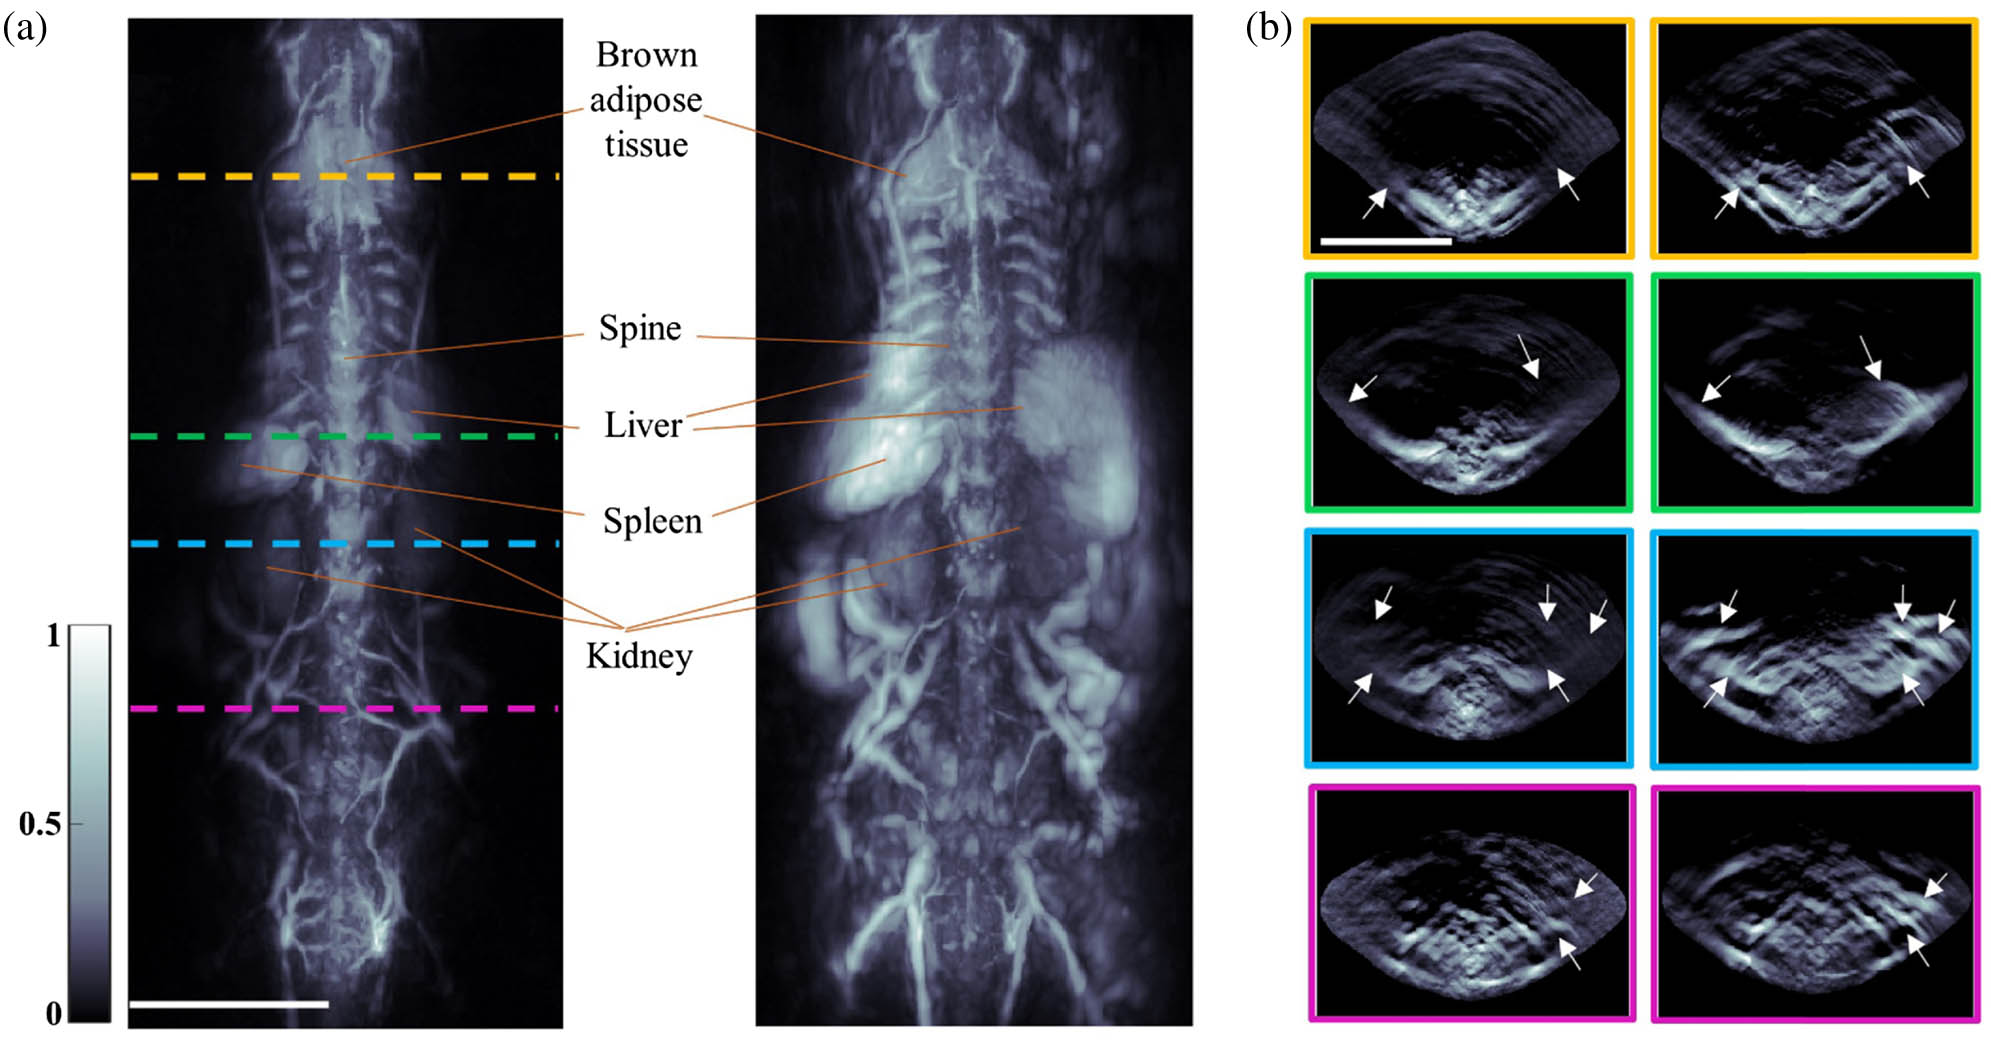
    Fig. 2. In vivo comparison study between the single-beam and multibeam illumination approaches. (a) Images reconstructed after single vertical sweeps using single-beam (left) and multibeam (right) illuminations. (b) Fluence corrected cross-sectional reconstructions (MIPs over 1 mm thickness) at several anatomical positions along the animal: (left) using single-beam and (right) using multibeam illumination. Arrows point to the differences. Scale bar: 1 cm.
    sSVOT images acquired from different viewing angles (from left to right: front, left back, back, right back) at a 10 mm/s scan speed (6.9 s total scan time per compounded image) with the 16× subelements and icmax compounding method: 1, brown adipose tissue; 2, spinal cord; 3, spleen; 4, kidney; 5, liver; 6, cecum; 7, heart; 8, duodenum; and 9, thoracic vessels. Scale bar: 1 cm.
    Fig. 3. sSVOT images acquired from different viewing angles (from left to right: front, left back, back, right back) at a 10 mm/s scan speed (6.9 s total scan time per compounded image) with the 16× subelements and icmax compounding method: 1, brown adipose tissue; 2, spinal cord; 3, spleen; 4, kidney; 5, liver; 6, cecum; 7, heart; 8, duodenum; and 9, thoracic vessels. Scale bar: 1 cm.
    Cross-sectional image quality improvement with multibeam illumination for full rotation acquisitions. (a) Schematic set up (top view) for the full (360°) rotation of the spherical array using single-beam (left) and multibeam illumination (right). (b) Corresponding cross-sectional MIP images reconstructed over a 3 mm thickness at various elevational anatomical positions. Scale bar: 1 cm.
    Fig. 4. Cross-sectional image quality improvement with multibeam illumination for full rotation acquisitions. (a) Schematic set up (top view) for the full (360°) rotation of the spherical array using single-beam (left) and multibeam illumination (right). (b) Corresponding cross-sectional MIP images reconstructed over a 3 mm thickness at various elevational anatomical positions. Scale bar: 1 cm.
    Different reconstruction methods using subelement based back-projection algorithm. (a) Illustration of the spherical array with 512 sensing elements. (b) Subelement divisions used by the reconstruction algorithm are shown in zoom-ins: 1×, 4×, 9×, and 16× for each detecting element of the array. (c) Reconstructed image volumes (MIPs) across coronal view for a single position of the spherical array using element division into 1, 4, 9, and 16 subelements. (d) CNR comparison plot for various subelement-based reconstruction methods. Scale bar: 1 cm.
    Fig. 5. Different reconstruction methods using subelement based back-projection algorithm. (a) Illustration of the spherical array with 512 sensing elements. (b) Subelement divisions used by the reconstruction algorithm are shown in zoom-ins: 1×, 4×, 9×, and 16× for each detecting element of the array. (c) Reconstructed image volumes (MIPs) across coronal view for a single position of the spherical array using element division into 1, 4, 9, and 16 subelements. (d) CNR comparison plot for various subelement-based reconstruction methods. Scale bar: 1 cm.
    Performance comparison of sSVOT reconstruction performed with different compounding methods: summation (sum), inverse center distance weighting (ICDW), maximum (max), sum with weighted max (sumax), and ICDW with weighted max (icmax). (a) sSVOT reconstructed image using icmax compounding method. Scale bar: 1 cm. (b) Zoomed-in regions of interest (ROI1, ROI2, and ROI3) compare the differences when employing various volume compounding techniques. Arrows point to the differences.
    Fig. 6. Performance comparison of sSVOT reconstruction performed with different compounding methods: summation (sum), inverse center distance weighting (ICDW), maximum (max), sum with weighted max (sumax), and ICDW with weighted max (icmax). (a) sSVOT reconstructed image using icmax compounding method. Scale bar: 1 cm. (b) Zoomed-in regions of interest (ROI1, ROI2, and ROI3) compare the differences when employing various volume compounding techniques. Arrows point to the differences.
    Performance comparison of sSVOT system for different scan velocities of 10, 20, 40, and 80 mm/s and subelement-based reconstructions. (a) Reconstructed mice volume for a single vertical sweep at a 80 mm/s scan speed using 16× subelement division with the icmax compounding method. Scale bar: 1 cm. (b) Zoomed-in regions of interest (ROI1 and ROI2) compare different scan velocities with the 1× and 16× subelement reconstruction methods.
    Fig. 7. Performance comparison of sSVOT system for different scan velocities of 10, 20, 40, and 80 mm/s and subelement-based reconstructions. (a) Reconstructed mice volume for a single vertical sweep at a 80 mm/s scan speed using 16× subelement division with the icmax compounding method. Scale bar: 1 cm. (b) Zoomed-in regions of interest (ROI1 and ROI2) compare different scan velocities with the 1× and 16× subelement reconstruction methods.
    Sandeep Kumar Kalva, Xose Luis Dean-Ben, Daniel Razansky. Single-sweep volumetric optoacoustic tomography of whole mice[J]. Photonics Research, 2021, 9(6): 899
    Download Citation