
Sandeep Kumar Kalva, Xose Luis Dean-Ben, Daniel Razansky. Single-sweep volumetric optoacoustic tomography of whole mice[J]. Photonics Research, 2021, 9(6): 899
- Photonics Research
- Vol. 9, Issue 6, 899 (2021)
Abstract
1. INTRODUCTION
Small animal models are extensively used in biomedical research to study human disease progression and monitor responses to therapies [1,2]. Several clinical imaging modalities, such as computed tomography (CT) [3], magnetic resonance imaging (MRI) [4,5], positron emission tomography (PET) [6], and pulse-echo ultrasound (US) [7,8], have been downscaled for preclinical imaging applications. Other approaches based on optical contrast have further been developed for functional and molecular imaging of mice and other rodents at the whole body level [9,10]. The optical methodologies have the particular advantage of rich functional and molecular contrast while being free of ionizing radiation [11]. Optoacoustic tomography (OAT) in particular has been gaining prominence in preclinical and clinical research [12–14] because it uniquely combines the spectral sensitivity and contrast of optical imaging with high spatial resolution provided by US [15]. Additionally, OAT systems have recently been advanced to enable two-dimensional (2D) or 3D imaging of limited areas at frame rates of hundreds to thousands of hertz [16–18].
Generally, the spatio-temporal resolution of OAT inversely scales with the field of view (FOV). Several implementations of OAT systems based on different types of light delivery methods and US detection geometries have been used for small animal imaging. Whole-body configuration examples include linear arrays translated and rotated to cover a mouse [19], curved/arc shaped transducers rotated around the longitudinal axis of the animal [20], longitudinal translation of concave arrays with cylindrically focused elements [21,22], or sparse hemispherical arrays rotated around the central axis [23,24]. For all these configurations, imaging of the entire mouse is achieved in a relatively long time—typically tens of minutes. This hampers their applicability e.g. for pharmacokinetics and pharmacodynamics studies within a relatively large region. Alternatively, real-time imaging can be achieved in a relatively small 2D or 3D region with
Here, we introduce single-sweep volumetric optoacoustic tomography (sSVOT) as what we believe, to the best of our knowledge, is a new approach for high-frame-rate imaging of large volumes in mice. This was achieved by employing a fiber bundle bifurcated into five individual output arms arranged in a light delivery scheme that concomitantly illuminates larger portions of the mouse body. A new spherical array was also specifically designed to attain an optimal trade-off between the FOV and imaging speed. It is shown that superior image quality can be achieved by using a single vertical sweep of the array together with the proper illumination arrangement. The performance of sSVOT is assessed as a function of the reconstruction method and the scanning speed while a systematic comparison to previously reported whole-body imaging implementations is further performed.
Sign up for Photonics Research TOC. Get the latest issue of Photonics Research delivered right to you!Sign up now
2. MATERIALS AND METHODS
A. sSVOT Experimental Setup
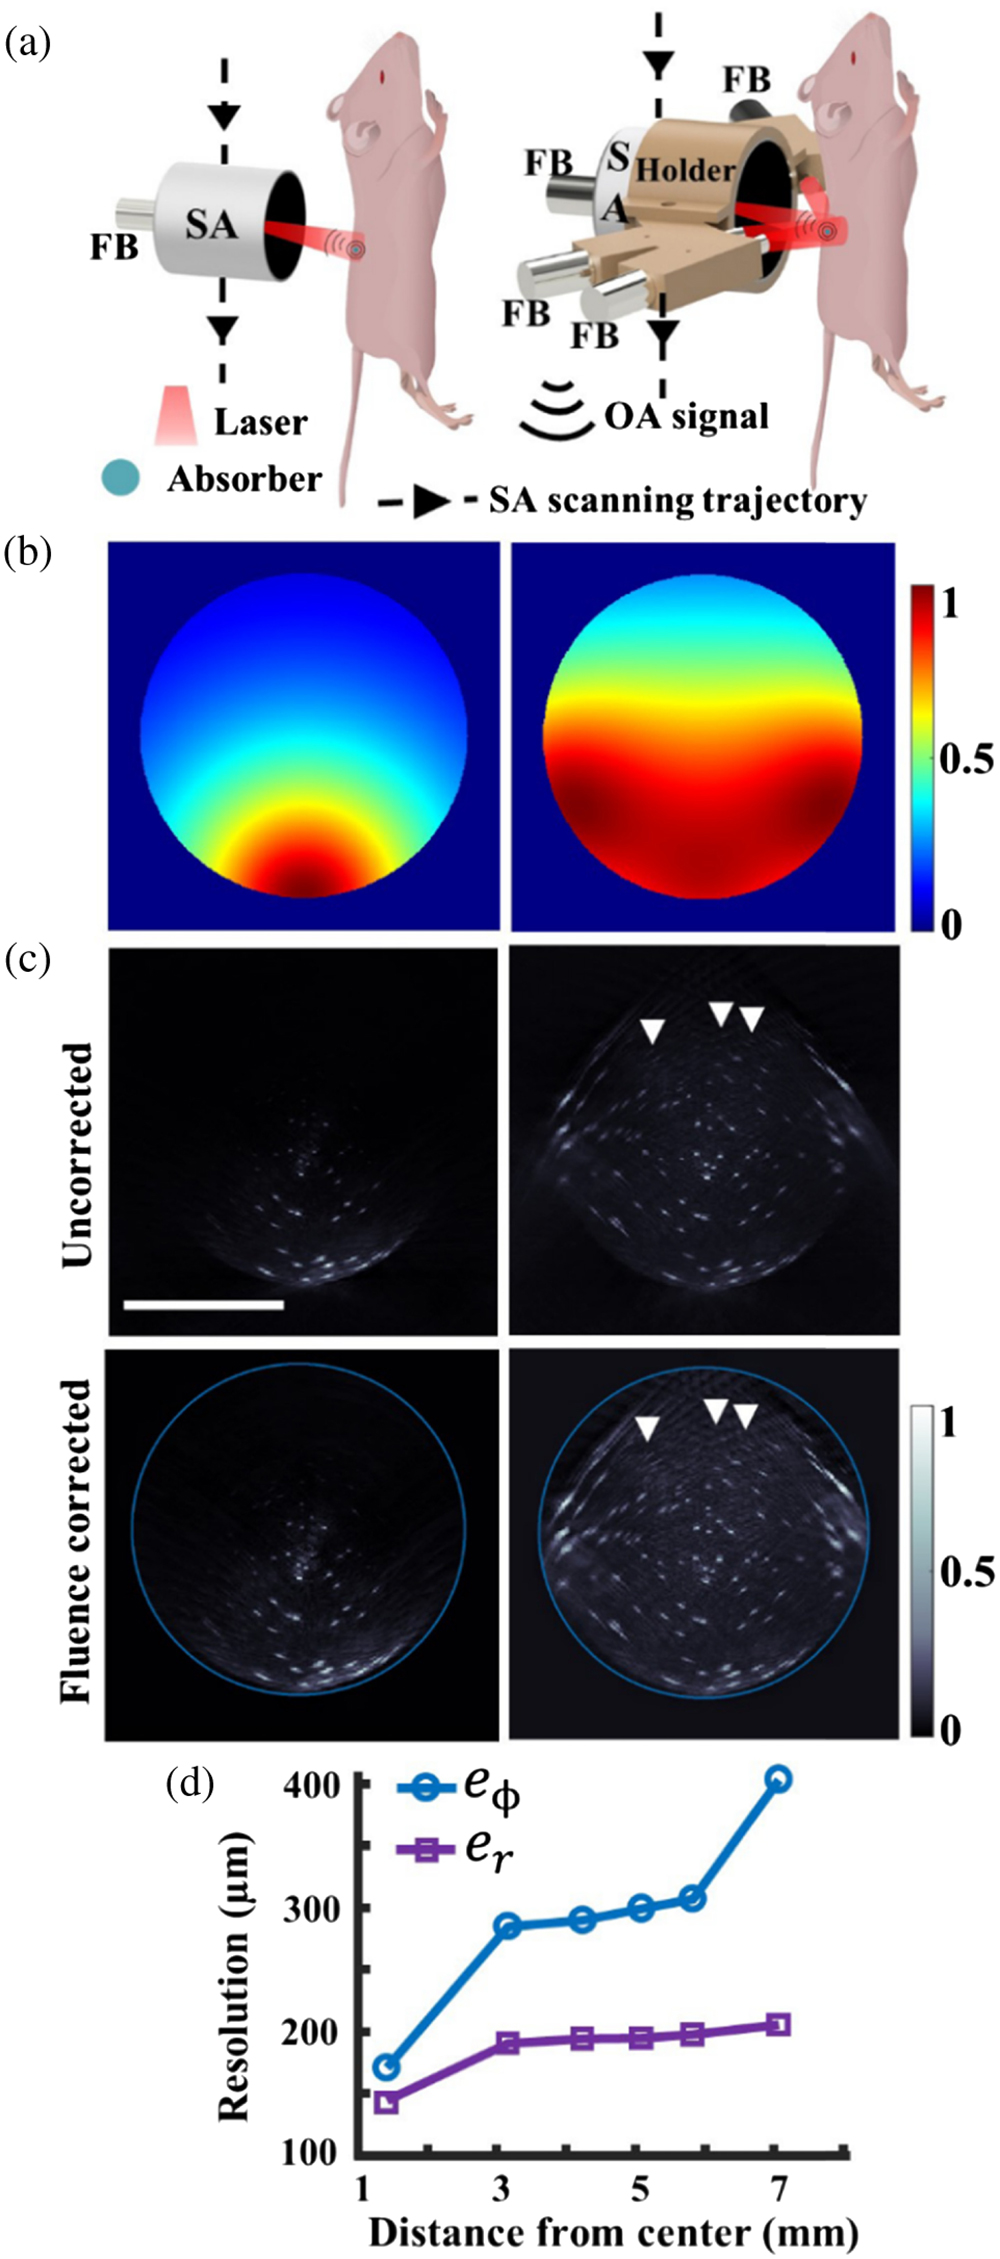
Figure 1.Single-sweep volumetric optoacoustic tomography (sSVOT) system characterization. (a) Schematic of the sSVOT scanner showing the difference between the single-beam illumination based (left) and multibeam illumination (right) approach. SA, spherical array; FB, fiber bundle; and OA, optoacoustic. (b) Simulated light distribution models for single-beam illumination (left) and multibeam illumination (right). (c) Maximum intensity projections (MIPs) across cross-sectional view demonstrating the spheres using single-beam (top left) and multibeam illumination (top right) approaches at single position of the spherical array. The corresponding fluence corrected images are shown at the bottom row. Arrows point to the spheres that appeared after the fluence correction. (d) Characterization of the reconstructed microsphere size in the central imaging plane along the radial (
B. sSVOT Scanning Procedure
sSVOT scans were carried out by continuous motion of the spherical array detector together with the output(s) of the fiber bundle along the vertical direction. In the current implementation, mice were scanned from head to tail by acquiring 10 volumes per second (dictated by the pulse repetition rate of the OPO laser). The position of the spherical array was controlled using a motorized stage that can be translated in the vertical () direction (RCP2-RGD6C, IAI Inc., Shizuoka Prefecture, Japan). The vertical motor has a load-bearing capacity of up to 8 kg and can cover a range of up to 15 cm with a maximum scanning velocity of 80 mm/s. There was no vibrational noise generated by the motor because the total weight of the spherical array together with fiber bundles, the associated cables, and the counter weight balance (to the transducer) was away below the maximum load capacity of the motor. The exact position of this stage was monitored with a high-resolution distance (time-of-flight position) sensor (Keyence Deutschland GmbH, Neu-Isenburg, Germany) providing a sufficiently large distance range () to cover the entire mouse scan. The distance sensor was triggered in sync with the DAQ by the laser pulse trigger signal from the OPO laser and the motor positions were controlled using a computer with MATLAB (R2020b). With continuous motion of the spherical array, consecutive volumetric frames overlap for each laser pulse. Generally, higher overlapping between compounded frames is produced for slower scanning speeds, which results in an averaging effect that increases the image contrast. The pitch (distance) between neighboring frames is given by the velocity/frame rate. For example, a motor velocity of 10 mm/s and a pulse repetition rate of 10 Hz lead to a pitch of 1 mm. Considering the FOV extending over 10 mm along the vertical axis, there is overlap between consecutive volumes. Naturally, the signal-to-noise-ratio (SNR) depends on the number of overlapping volumes and is hence expected to be lower if the scanning velocity is increased. Higher scanning velocity diminishes the overlap between the consecutive volumetric frames, worsening the SNR and overall image quality. The dependence of the SNR on the scanning velocity is elaborated in significant detail in Ref. [30].
C. Phantom Experiments
The effectiveness of the multibeam illumination approach was initially tested using a tissue that mimicked a 20 mm cylindrical phantom consisting of agar (1.3% by weight) containing black India ink and 1.2% by volume of Intralipid to simulate a background absorption coefficient of and a reduced scattering coefficient of in average biological tissues at the 800 nm excitation wavelength used in the experiments [31]. A cloud of black polyethylene absorbing microspheres (Cospheric LLC, Santa Barbara, CA, USA) approximately 100 μm in diameter was embedded into the phantom. The data was collected at a single position of the spherical array by using all five outputs of the bundle and compared against the conventional illumination configuration only employing a single direction illumination through the cavity of the array [Fig. 1(c)]. The acquired signals were averaged 100 times to achieve a better SNR.
D. Animal Experiments
E. Image Reconstruction and Analysis
The recorded time-resolved OA signals were initially bandpass-filtered within the 0.1–12 MHz frequency range covering the entire detectable bandwidth of the transducer and deconvolved with the impulse response of the US array sensing elements [32]. Image reconstruction of individual volumetric frames was carried out using a graphics processing unit (GPU) implementation of the back-projection (BP) algorithm [33]. Note that an average speed of sound of 1486 m/s and 1525 m/s was used during the reconstruction for phantom and
The ICDW algorithm considers weighting the voxels in each individual volume according to the distance from the center of the respective volume, then adding the individual volumes after proper translation and normalizing them with the sum of all weights for each voxel in the compounded volume. This operation is described as
3. RESULTS
A. Multibeam Illumination Approach
The multibeam illumination approach based on a fiber bundle with five output arms significantly enhances the homogeneity of light intensity throughout the sample. For better comprehension, we have shown the approximate simulations of the 2D light distribution over a 20 mm diameter circular region simulating a typical cross-section of the mouse, based on superimposing exponentially decaying functions of the form , for each output fiber bundle [Fig. 1(b)]. The simulations were executed on a grid with µm/pixel resolution. The initial points of light delivery for a single-beam and multibeam illumination were chosen on the circumference of the circle having a wide strip at the respective angular position of each fiber bundle. Clearly, more homogenous light illumination allows us to fully exploit the effective FOV of the spherical array. Only a small part of a tissue-mimicking phantom containing sparsely distributed spheres was visible at a single position of the spherical array when using single-beam illumination [Fig. 1(c), left]. However, the entire phantom could be covered with the multibeam illumination [Fig. 1(c),right], which facilitated discernment of nearly all the microspheres. After employing fluence correction using the exponentially decaying function, some of the spheres (pointed with arrows) were only discerned in the corrected images [Fig. 1(c), bottom row] in contrast to the uncorrected ones [Fig. 1(c), top row]. Note that the microspheres have a much stronger absorption coefficient than the surrounding background mimicking the average optical tissue properties. After fluence correction, we were able to fully visualize microspheres in addition to the partially visible phantom background up to depth using the multibeam illumination approach [Fig. 1(c), bottom right], whereas a limited effective penetration depth of was observed with the single-beam illumination approach [Fig. 1(c), bottom left]. Note that the spheres on the edge of the phantom were distorted compared to the ones in the center due to limited-view effects and directivity of the elements, which lead to degradation of the spatial resolution provided by the spherical array. The latter performance was estimated along the radial () and azimuthal () directions as a function of the radial distance from the center by imaging a 30 μm sphere at different positions across the FOV. The spatial resolution of the system (size of the reconstructed microsphere) along the radial and azimuthal directions ranged from 130–200 μm to 170–400 μm, respectively [Fig. 1(d)].
B. Whole-Body Mouse Scans
![]()
Figure 2.
![]()
Figure 3.sSVOT images acquired from different viewing angles (from left to right: front, left back, back, right back) at a 10 mm/s scan speed (6.9 s total scan time per compounded image) with the 16× subelements and icmax compounding method: 1, brown adipose tissue; 2, spinal cord; 3, spleen; 4, kidney; 5, liver; 6, cecum; 7, heart; 8, duodenum; and 9, thoracic vessels. Scale bar: 1 cm.
![]()
Figure 4.Cross-sectional image quality improvement with multibeam illumination for full rotation acquisitions. (a) Schematic set up (top view) for the full (360°) rotation of the spherical array using single-beam (left) and multibeam illumination (right). (b) Corresponding cross-sectional MIP images reconstructed over a 3 mm thickness at various elevational anatomical positions. Scale bar: 1 cm.
C. Reconstruction Methods
![]()
Figure 5.Different reconstruction methods using subelement based back-projection algorithm. (a) Illustration of the spherical array with 512 sensing elements. (b) Subelement divisions used by the reconstruction algorithm are shown in zoom-ins:
![]()
Figure 6.Performance comparison of sSVOT reconstruction performed with different compounding methods: summation (sum), inverse center distance weighting (ICDW), maximum (max), sum with weighted max (sumax), and ICDW with weighted max (icmax). (a) sSVOT reconstructed image using icmax compounding method. Scale bar: 1 cm. (b) Zoomed-in regions of interest (ROI1, ROI2, and ROI3) compare the differences when employing various volume compounding techniques. Arrows point to the differences.
D. Rapid Single-Sweep Scans
![]()
Figure 7.Performance comparison of sSVOT system for different scan velocities of 10, 20, 40, and 80 mm/s and subelement-based reconstructions. (a) Reconstructed mice volume for a single vertical sweep at a 80 mm/s scan speed using
4. DISCUSSION AND CONCLUSIONS
The single-vertical sweep protocol of the sSVOT imaging scanner introduced in this work offers what we believe are new venues to study rapid biodynamics. The multibeam illumination approach used in sSVOT played a critical role in expanding the FOV, achieving deeper penetration into the animal body and improving the overall image quality and speed. With these advantages, multiple organs and surrounding vascular structures could be imaged across the whole body of a mouse, from head to tail. Scan speeds of up to 80 mm/s, leading to a temporal resolution of 1.8 s, are far beyond what is achievable with other whole-body preclinical imaging modalities. We believe this high-speed imaging could be of particular importance in many applications, such as in cancer research for assessing vascular perfusion function or for studying accumulation and retention of nanodrug formulations in tumors [43]. By visualizing multiple contrast agent kinetics simultaneously throughout the mouse body, sSVOT may play a major role in other molecular imaging and drug development applications.
Generally, a trade-off between FOV and spatial resolution is expected in any OA imaging embodiment [15,44]. The spherical array employed in the sSVOT scanner provides an almost isotropic resolution of at the center of the FOV, which progressively degrades at laterally shifted positions [32]. Note also that the limited-view effects are, more likely to affect the peripheral regions of the mouse [45]. Those can be mitigated by increasing the angular coverage of the spherical array; however, this is detrimental to the effectively covered FOV. The frequency and angular coverage of the newly designed array were selected to efficiently cover the entire width of the mouse. A better tomographic coverage and higher resolution within the entire mouse body can be achieved by laterally scanning and/or rotating the array around the animal. We have shown that high-quality, cross-sectional images could be obtained by rotating the array for 360° at a total of nine azimuthal angles, which can still be performed in a relatively short time.
Optimal selection of the image formation method was also vital to improve the quality of the images. A comparison of the performance of the sSVOT for different reconstruction methods and scan speeds showed that the ICDW compounding with the weighted maximum method outperformed other compounding methods and that the subelement back-projection reconstruction method could mitigate the streak artifacts that appeared with the -element back-projection reconstruction in fast scans. More advanced reconstruction approaches (e.g., based on spatiotemporal antialiasing method) [40,41] or model-based (iterative) methods, can further help improve image quality at the expense of longer computation times [39,46]. However, the back-projection reconstruction has the clear advantage of real-time image rendering, even when multiple subelements are considered. This enables an on-the-fly preview during acquisitions, which is important to optimize the experimental measurements.
Another key aspect to be taken into account is the object’s motion (e.g., related to heartbeat or respiration). For a high scan speed of 80 mm/s and a 10 Hz pulse repetition rate (PRF) of the laser, the array moves between consecutive laser pulses, while each reconstructed frame covers in the vertical direction. Therefore, only a 20% volume overlap exists between the consecutive frames. Motion artifacts are then generally manifested as structural inaccuracies in the compounded images rather than as blurring and loss of resolution and contrast, as is the case when scanning the array at lower speeds or using a higher PRF. Respiratory motion suppression algorithms [47] and/or gated acquisition approaches [48–50] may further be employed to enhance image quality by mitigating the common motion artifacts in the compounded images.
In summary, sSVOT achieves rapid scanning of a large portion of the mouse body with excellent image contrast and resolution. The multibeam illumination approach was shown to be essential to enhance the achievable FOV and effective penetration. We exploited the system for large-scale imaging of mice with a single vertical sweep of a spherical array, demonstrating the feasibility of visualizing multiple organs and their surrounding vasculature without the need for signal averaging. We believe that sSVOT has the potential to massively impact biomedical studies focusing on whole-body imaging of rapid biological dynamics.
Acknowledgment
Acknowledgment. The authors would like to thank M. Reiss for his support with the measurements and animal handling, and H. Estrada, U. A. T. Hofmann, A. Ozbek, B. Lafci, and S. Nitkunanantharajah for their valuable advice.
References
[1] F. Kiessling, B. J. Pichler. Small Animal Imaging: Basics and Practical Guide(2010).
[2] M. Baker. The whole picture. Nature, 463, 977-979(2010).
[3] C. Badea, M. Drangova, D. W. Holdsworth, G. A. Johnson.
[4] R. G. Pautler, S. C. Fraser. The year(s) of the contrast agent–micro-MRI in the new millennium. Curr. Opin. Immunol., 15, 385-392(2003).
[5] H. Benveniste, S. Blackband. MR microscopy and high resolution small animal MRI: applications in neuroscience research. Prog. Neurobiol., 67, 393-420(2002).
[6] H. R. Herschman. Micro-PET imaging and small animal models of disease. Curr. Opin. Immunol., 15, 378-384(2003).
[7] L. A. Wirtzfeld, G. Wu, M. Bygrave, Y. Yamasaki, H. Sakai, M. Moussa, J. I. Izawa, D. B. Downey, N. M. Greenberg, A. Fenster, J. W. Xuan, J. C. Lacefield. A new three-dimensional ultrasound microimaging technology for preclinical studies using a transgenic prostate cancer mouse model. Cancer Res., 65, 6337-6345(2005).
[8] A. Greco, M. Mancini, S. Gargiulo, M. Gramanzini, P. P. Claudio, A. Brunetti, M. Salvatore. Ultrasound biomicroscopy in small animal research: applications in molecular and preclinical imaging. J. Biomed. Biotechnol., 2012, 519238(2012).
[9] A. H. Hielscher. Optical tomographic imaging of small animals. Curr. Opin. Biotechnol., 16, 79-88(2005).
[10] M. Yang, E. Baranov, P. Jiang, F.-X. Sun, X.-M. Li, L. Li, S. Hasegawa, M. Bouvet, M. Al-Tuwaijri, T. Chishima, H. Shimada, A. R. Moossa, S. Penman, R. M. Hoffman. Whole-body optical imaging of green fluorescent protein-expressing tumors and metastases. Proc. Natl. Acad. Sci. USA, 97, 1206-1211(2000).
[11] F. Leblond, S. C. Davis, P. A. Valdés, B. W. Pogue. Pre-clinical whole-body fluorescence imaging: review of instruments, methods and applications. J. Photochem. Photobiol. B, 98, 77-94(2010).
[12] P. Beard. Biomedical photoacoustic imaging. Interface Focus, 1, 602-631(2011).
[13] S. Manohar, D. Razansky. Photoacoustics: a historical review. Adv. Opt. Photon., 8, 586-617(2016).
[14] M. Heijblom, D. Piras, M. Brinkhuis, J. C. G. van Hespen, F. M. van den Engh, M. van der Schaaf, J. M. Klaase, T. G. van Leeuwen, W. Steenbergen, S. Manohar. Photoacoustic image patterns of breast carcinoma and comparisons with magnetic resonance imaging and vascular stained histopathology. Sci. Rep., 5, 11778(2015).
[15] L. V. Wang, S. Hu. Photoacoustic tomography:
[16] X. L. Dean-Ben, S. J. Ford, D. Razansky. High-frame rate four dimensional optoacoustic tomography enables visualization of cardiovascular dynamics and mouse heart perfusion. Sci. Rep., 5, 10133(2015).
[17] A. Özbek, X. L. Deán-Ben, D. Razansky. Optoacoustic imaging at kilohertz volumetric frame rates. Optica, 5, 857-863(2018).
[18] K. Sivasubramanian, M. Pramanik. High frame rate photoacoustic imaging at 7000 frames per second using clinical ultrasound system. Biomed. Opt. Express, 7, 312-323(2016).
[19] J. Gateau, M. A. A. Caballero, A. Dima, V. Ntziachristos. Three-dimensional optoacoustic tomography using a conventional ultrasound linear detector array: whole-body tomographic system for small animals. Med. Phys., 40, 013302(2013).
[20] H.-P. F. Brecht, R. Su, M. Fronheiser, S. A. Ermilov, A. Conjusteau, A. A. Oraevsky. Whole-body three-dimensional optoacoustic tomography system for small animals. J. Biomed. Opt., 14, 064007(2009).
[21] J. Xia, M. R. Chatni, K. Maslov, Z. Guo, K. Wang, M. Anastasio, L. V. Wang. Whole-body ring-shaped confocal photoacoustic computed tomography of small animals
[22] D. Razansky, A. Buehler, V. Ntziachristos. Volumetric real-time multispectral optoacoustic tomography of biomarkers. Nat. Protoc., 6, 1121-1129(2011).
[23] R. Kruger, D. Reinecke, G. Kruger, M. Thornton, P. Picot, T. Morgan, K. Stantz, C. Mistretta. HYPR-spectral photoacoustic CT for preclinical imaging. Proc. SPIE, 7177, 71770F(2009).
[24] J. Lv, Y. Peng, S. Li, Z. Guo, Q. Zhao, X. Zhang, L. Nie. Hemispherical photoacoustic imaging of myocardial infarction:
[25] X. L. Deán-Ben, D. Razansky. Adding fifth dimension to optoacoustic imaging: volumetric time-resolved spectrally enriched tomography. Light Sci. Appl., 3, e137(2014).
[26] S. Gottschalk, T. F. Fehm, X. L. Deán-Ben, D. Razansky. Noninvasive real-time visualization of multiple cerebral hemodynamic parameters in whole mouse brains using five-dimensional optoacoustic tomography. J. Cereb. Blood Flow Metab., 35, 531-535(2015).
[27] T. F. Fehm, X. L. Deán-Ben, S. J. Ford, D. Razansky.
[28] X. L. Deán-Ben, T. F. Fehm, S. J. Ford, S. Gottschalk, D. Razansky. Spiral volumetric optoacoustic tomography visualizes multi-scale dynamics in mice. Light Sci. Appl., 6, e16247(2017).
[29] . American National Standard for safe use of lasers(2007).
[30] A. Ron, S. K. Kalva, V. Periyasamy, X. L. Deán-Ben, D. Razansky. Flash scanning volumetric optoacoustic tomography for high resolution whole-body tracking of nanoagent kinetics and biodistribution. Laser Photon. Rev., 15, 2000484(2021).
[31] S. L. Jacques. Optical properties of biological tissues: a review. Phys. Med. Biol., 58, R37-R61(2013).
[32] X. L. Dean-Ben, D. Razansky. Portable spherical array probe for volumetric real-time optoacoustic imaging at centimeter-scale depths. Opt. Express, 21, 28062-28071(2013).
[33] X. L. Dean-Ben, A. Ozbek, D. Razansky. Volumetric real-time tracking of peripheral human vasculature with GPU-accelerated three-dimensional optoacoustic tomography. IEEE Trans. Med. Imaging, 32, 2050-2055(2013).
[34] S. K. Kalva, M. Pramanik. Experimental validation of tangential resolution improvement in photoacoustic tomography using a modified delay-and-sum reconstruction algorithm. J. Biomed. Opt., 21, 086011(2016).
[35] S. Nitkunanantharajah, C. Hennersperger, X. L. Dean-Ben, D. Razansky, N. Navab. Trackerless panoramic optoacoustic imaging: a first feasibility evaluation. Int. J. Comput. Assist. Radiol. Surg., 13, 703-711(2018).
[36] S. Cinti. The adipose organ at a glance. Dis. Models Mech., 5, 588-594(2012).
[37] A. Karlas, J. Reber, E. Liapis, K. Paul-Yuan, V. Ntziachristos. Multispectral optoacoustic tomography of brown adipose tissue. Brown Adipose Tissue, 325-336(2018).
[38] A. Ron, X. L. Deán-Ben, J. Reber, V. Ntziachristos, D. Razansky. Characterization of brown adipose tissue in a diabetic mouse model with spiral volumetric optoacoustic tomography. Mol. Imaging Biol., 21, 620-625(2019).
[39] X. L. Dean-Ben, A. Buehler, V. Ntziachristos, D. Razansky. Accurate model-based reconstruction algorithm for three-dimensional optoacoustic tomography. IEEE Trans. Med. Imaging, 31, 1922-1928(2012).
[40] P. Hu, L. Li, L. Lin, L. V. Wang. Spatiotemporal antialiasing in photoacoustic computed tomography. IEEE Trans. Med. Imaging, 39, 3535-3547(2020).
[41] L. Li, L. Zhu, C. Ma, L. Lin, J. Yao, L. Wang, K. Maslov, R. Zhang, W. Chen, J. Shi, L. V. Wang. Single-impulse panoramic photoacoustic computed tomography of small-animal whole-body dynamics at high spatiotemporal resolution. Nat. Biomed. Eng., 1, 0071(2017).
[42] X. Song, B. W. Pogue, S. Jiang, M. M. Doyley, H. Dehghani, T. D. Tosteson, K. D. Paulsen. Automated region detection based on the contrast-to-noise ratio in near-infrared tomography. Appl. Opt., 43, 1053-1062(2004).
[43] W. Song, Z. Tang, D. Zhang, N. Burton, W. Driessenb, X. Chen. Comprehensive studies of pharmacokinetics and biodistribution of indocyanine green and liposomal indocyanine green by multispectral optoacoustic tomography. RSC Adv., 5, 3807-3813(2015).
[44] X. L. Deán-Ben, S. Gottschalk, B. Mc Larney, S. Shohamc, D. Razansky. Advanced optoacoustic methods for multiscale imaging of
[45] Y. Xu, L. V. Wang, G. Ambartsoumian, P. Kuchment. Reconstructions in limited-view thermoacoustic tomography. Med. Phys., 31, 724-733(2004).
[46] L. Ding, X. L. Deán-Ben, D. Razansky. Efficient 3-D model-based reconstruction scheme for arbitrary optoacoustic acquisition geometries. IEEE Trans. Med. Imaging, 36, 1858-1867(2017).
[47] A. Ron, N. Davoudi, X. L. Deán-Ben, D. Razansky. Self-gated respiratory motion rejection for optoacoustic tomography. Appl. Sci., 9, 2737(2019).
[48] N. L. Ford, H. N. Nikolov, C. J. D. Norley, M. M. Thornton, P. J. Foster, M. Drangova, D. W. Holdsworth. Prospective respiratory-gated micro-CT of free breathing rodents. Med. Phys., 32, 2888-2898(2005).
[49] S. J. Schambach, S. Bag, L. Schilling, C. Groden, M. A. Brockmann. Application of micro-CT in small animal imaging. Methods, 50, 2-13(2010).
[50] J. Xia, W. Chen, K. Maslov, M. A. Anastasio, L. V. Wang. Retrospective respiration-gated whole-body photoacoustic computed tomography of mice. J. Biomed. Opt., 19, 016003(2014).

Set citation alerts for the article
Please enter your email address
© Copyright 2018-2021 | Chinese Laser Press. All Rights Reserved 沪ICP备15018463号-20