
Ruiqi Wang, Yan Zhao, Shikai Wu, Hongtao Lu. Multifeature Recognition Methods of Laser Welding Based on Line Array Camera[J]. Laser & Optoelectronics Progress, 2023, 60(1): 0114007
- Laser & Optoelectronics Progress
- Vol. 60, Issue 1, 0114007 (2023)
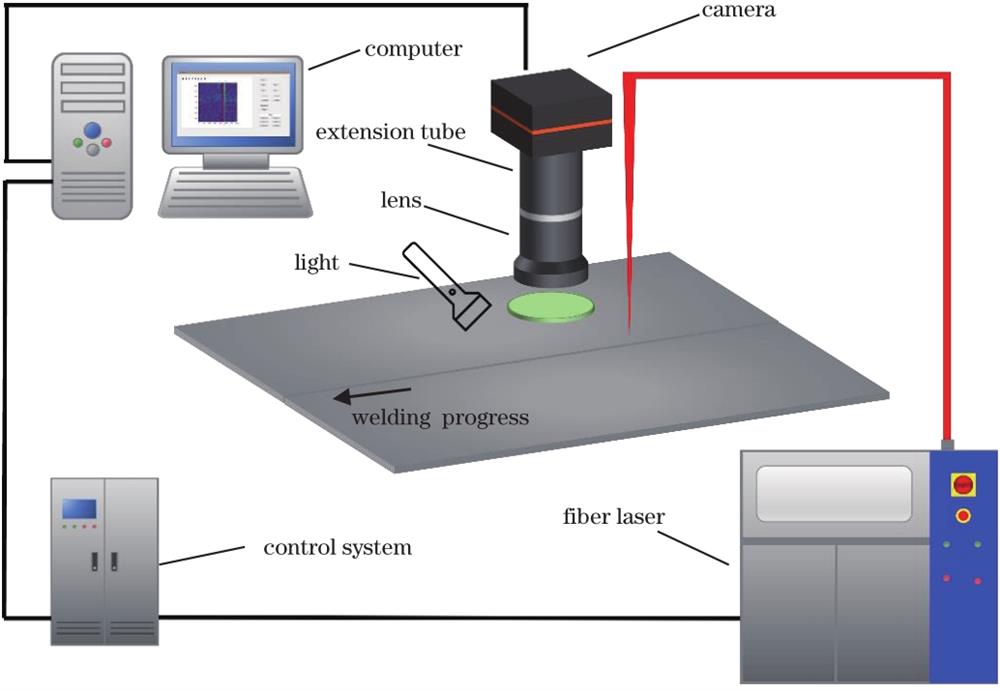
Fig. 1. Welding seam tracking experimental device
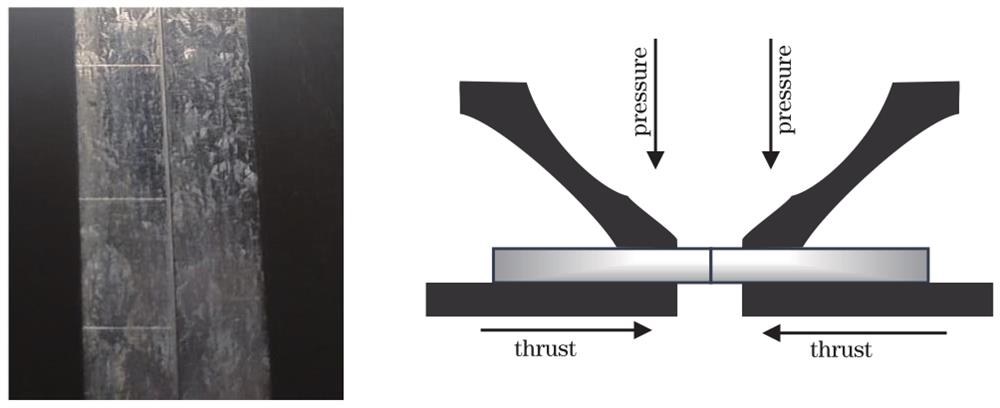
Fig. 2. Weld surface condition and welding fixtures
Fig. 3. ROI image and grayscale distribution
Fig. 4. Weld identification process. (a) Mean filtering; (b) extract seed points; (c) screening weld area
Fig. 5. Distribution of characteristic parameters. (a) Gray value of weld area; (b) gray value of undetermined weld area; (c) gray value change in the welding direction of the weld area; (d) gray value change in welding direction of undetermined weld area; (e) gray gradient of weld area; (f) gray gradient of undetermined weld area; (g) width of weld area; (h) width of undetermined weld area
Fig. 6. Influence of parameters in the algorithm on recognition effect and running time. (a) Mean filter size; (b) minimum gray threshold; (c) maximum gray value difference; (d) minimum weld area width
Fig. 7. Weld recognition results of different gaps. (a) 0.05 mm; (b) 0.1 mm; (c) 0.2 mm; (d) 0.3 mm; (e) 0.4 mm
Fig. 8. Weld recognition results of different scanning speeds. (a) 100 mm/s; (b) 200 mm/s; (c) 300 mm/s; (d) 350 mm/s
Fig. 9. Common steel plate weld tracking results
Fig. 10. Results of weld tracking. (a) Original picture; (b) weld track identified by the algorithm and the enlarged image of local details
Fig. 11. Weld cross section
Fig. 12. Weld trajectory and deviation value

Set citation alerts for the article
Please enter your email address
© Copyright 2018-2021 | Chinese Laser Press. All Rights Reserved 沪ICP备15018463号-20