
Zhongsheng Zhai, Yuansheng Huang, Qinyang Li, Xin Yu, Lü Qinghua, Boya Xie, Zhen Zeng. Diffraction Characteristics of Orthogonal Phase Grating Based on Spatial Light Modulator[J]. Acta Optica Sinica, 2022, 42(16): 1605002
- Acta Optica Sinica
- Vol. 42, Issue 16, 1605002 (2022)
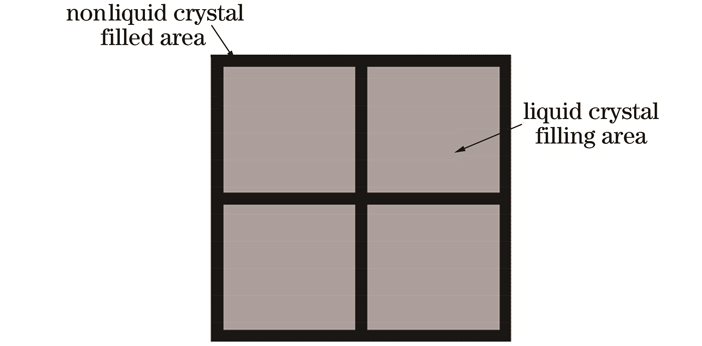
Fig. 1. Schematic diagram of SLM filling structure
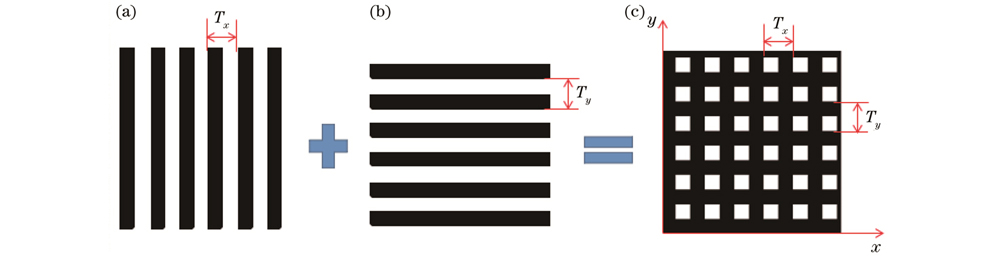
Fig. 2. Schematic diagrams of orthogonal phase grating.(a) Radial binary grating; (b) axial binary grating; (c) orthogonal phase grating
Fig. 3. Profile of orthogonal phase grating
Fig. 4. Orthogonal phase grating structure diagrams. (a) Orthogonal phase grating; (b) element structure of orthogonal grating
Fig. 5. Orthogonal grating results and their diffraction light intensity. (a) Orthogonal phase grating; (b) diffraction pattern of orthogonal phase grating
Fig. 6. Schematic diagrams of orthogonal phase grating with different grey levels. (a) Structural diagram of orthogonal phase gratings with different gray grades; (b) one-dimensional distribution of orthogonal phase grating
Fig. 7. Orthogonal phase gratings with different period and corresponding diffraction patterns. (a) Orthogonal phase gratings with different periods; (b) diffraction patterns corresponding to orthogonal phase gratings with different periods
Fig. 8. Orthogonal phase gratings with different phase modulation depth and corresponding diffraction patterns. (a) Structural diagrams of orthogonal phase gratings with different phase modulation depths; (b) diffraction patterns corresponding to orthogonal phase gratings with different phase modulation depth
Fig. 9. Variation of relative intensity of different diffraction orders varying with grey level
Fig. 10. Variation of diffraction efficiency of 1st order light varying with grey level
Fig. 11. Experimental results of diffraction for orthogonal phase gratings with different phase modulation depth
Fig. 12. Experimental results of relative intensity of different diffraction orders varying with grey level
| ||||||||||||||||||||||||||||||||||||||||||||||||||||||||||||||||||||||||||||
Table 1. Intensity of different orders calculated by Eqs. (9)-(11) and Fourier transform
| ||||||||||||||||||||||||||||||||
Table 2. Intensity of zero-orders calculated by Eq. (18) and experiments

Set citation alerts for the article
Please enter your email address
© Copyright 2018-2021 | Chinese Laser Press. All Rights Reserved 沪ICP备15018463号-20