
Guoen Weng, Jiyu Yan, Shengjie Chen, Chunhu Zhao, Hanbing Zhang, Jiao Tian, Yuejun Liu, Xiaobo Hu, Jiahua Tao, Shaoqiang Chen, Ziqiang Zhu, Hidefumi Akiyama, Junhao Chu, "Superior single-mode lasing in a self-assembly CsPbX3 microcavity over an ultrawide pumping wavelength range," Photonics Res. 9, 54 (2021)
- Photonics Research
- Vol. 9, Issue 1, 54 (2021)
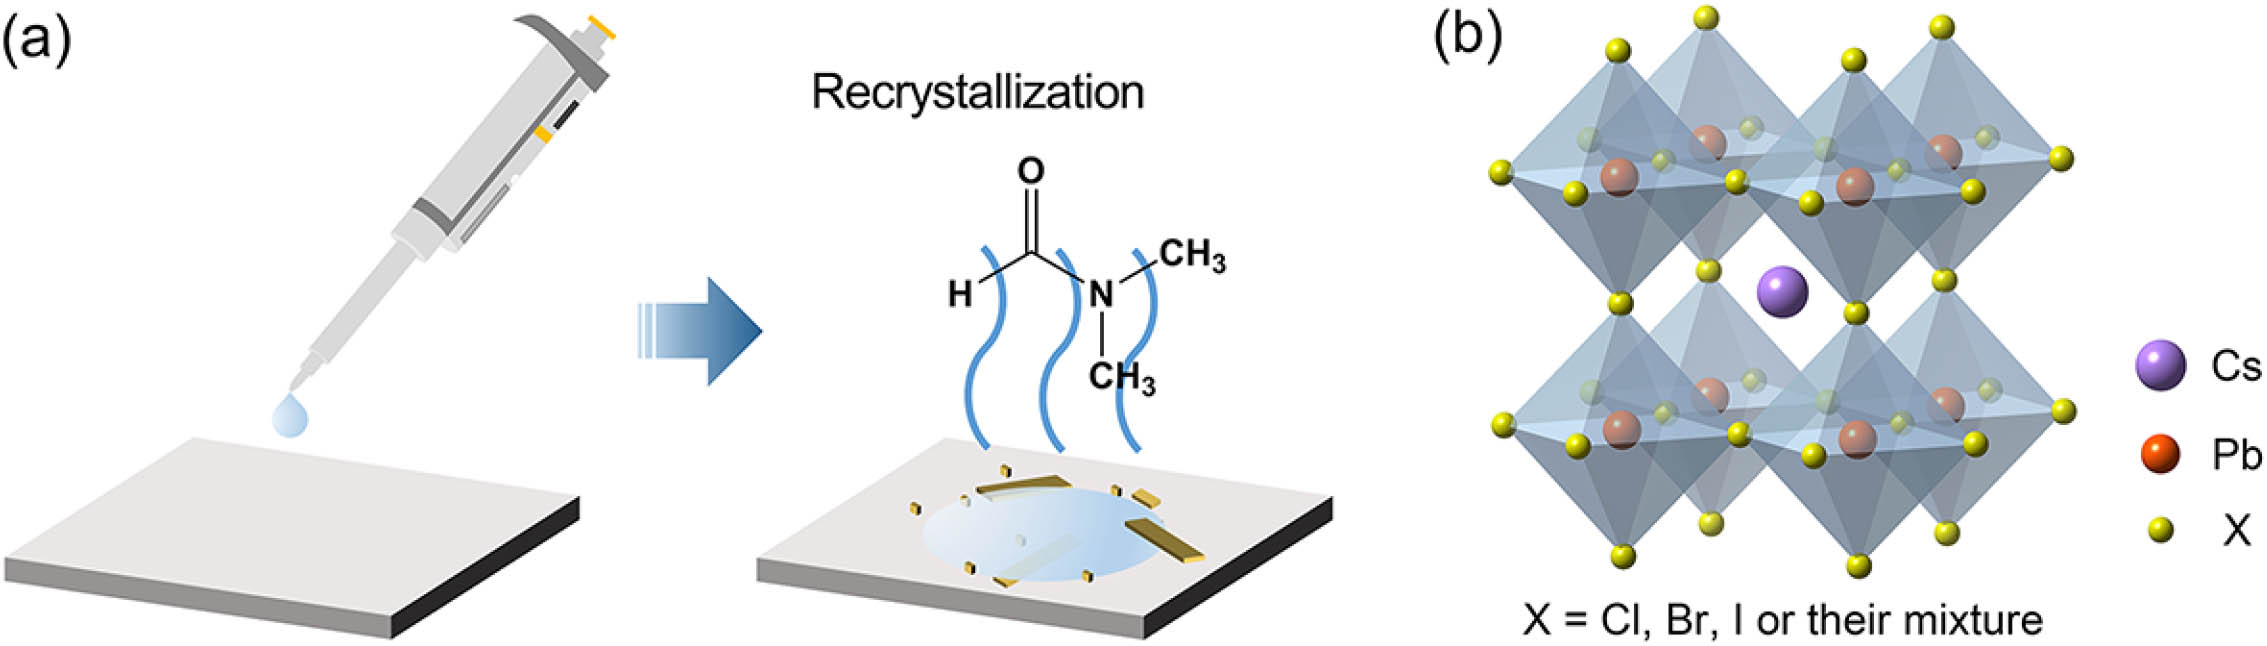
Fig. 1. Preparation of CsPbX 3 CsPbX 3 CsPbX 3 T h T h CsPbX 3 CsPbX 3
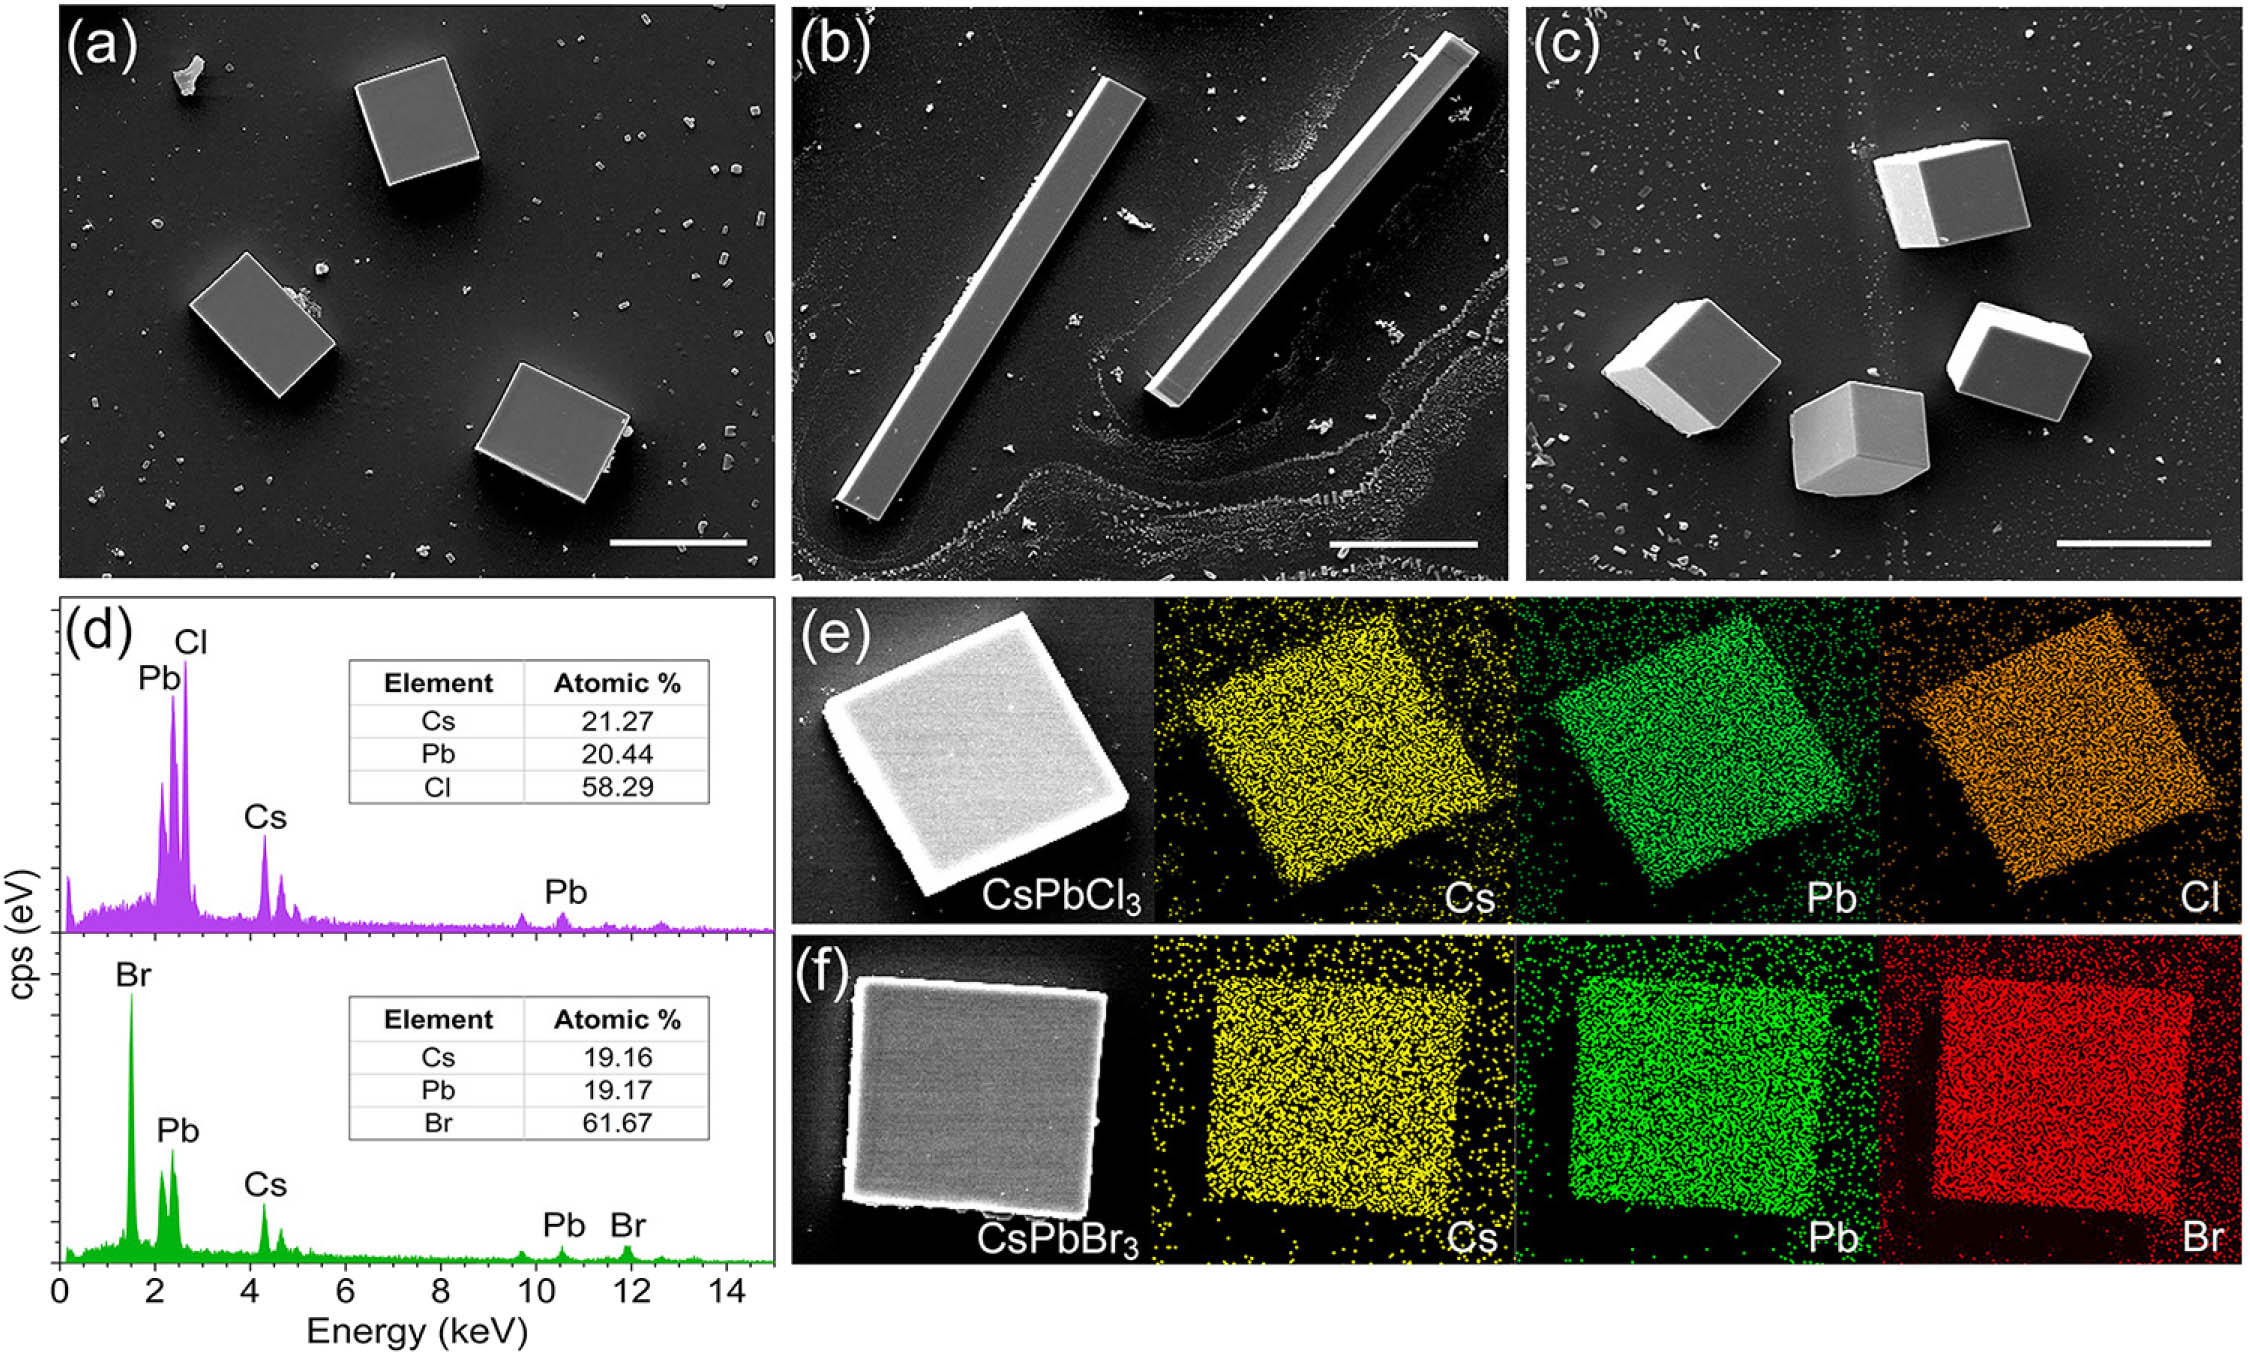
Fig. 2. Geometry of the CsPbCl x Br 3 − x CsPbBr 3 CsPbCl 3 CsPbBr 3 ∼ 1 : 1 : 3 CsPbCl 3 CsPbBr 3
Fig. 3. Tunable band-gap energies and emission spectra of the CsPbX 3 CsPbX 3 X = Cl β CD CsPbBr x I 3 − x 0 ≤ x < 3 β CD CsPbX 3 CsPbX 3 x
Fig. 4. Frequency downconversion single-mode lasing from CsPbCl x Br 3 − x CsPbBr 3 CsPbBr 3 ∼ 24.1 μJ / cm 2 ∼ 35.2 μJ / cm 2 δ λ ∼ 0.27 nm Q ∼ 2012 1.3 P th CsPbCl x Br 3 − x CsPbBr 3 1.5 P th
Fig. 5. Nonlinear frequency upconversion single-mode lasing from CsPbX 3 CsPbBr 3 1.1 P th CsPbBr 3 CsPbBr 3 k CsPbBr 3
Fig. 6. Lasing dynamics of the CsPbX 3 CsPbBr 3 0.8 P th 1.6 P th 0.5 P th 0.9 P th 1.2 P th CsPbBr 3 1.4 P th CsPbBr 3 1.05 P th 1.95 P th


Set citation alerts for the article
Please enter your email address

© Copyright 2018-2021 | Chinese Laser Press. All Rights Reserved 沪ICP备15018463号-20