• Photonics Research
  • Vol. 6, Issue 1, 6 (2018)
Byung-Min Yu1, Jeong-Min Lee1, Christian Mai2, Stefan Lischke2, Lars Zimmermann2, and Woo-Young Choi1、*
Author Affiliations
  • 1Department of Electrical and Electronic Engineering, Yonsei University, 50 Yonsei-Ro, Seodaemoon-gu, Seoul 120-749, South Korea
  • 2IHP, Im Technologiepark 25, 15236 Frankfurt (Oder), Germany
  • show less
    DOI: 10.1364/PRJ.6.000006 Cite this Article Set citation alerts
    Byung-Min Yu, Jeong-Min Lee, Christian Mai, Stefan Lischke, Lars Zimmermann, Woo-Young Choi. Single-chip Si optical single-sideband modulator[J]. Photonics Research, 2018, 6(1): 6 Copy Citation Text show less
    Block diagram of the OSSB modulator.
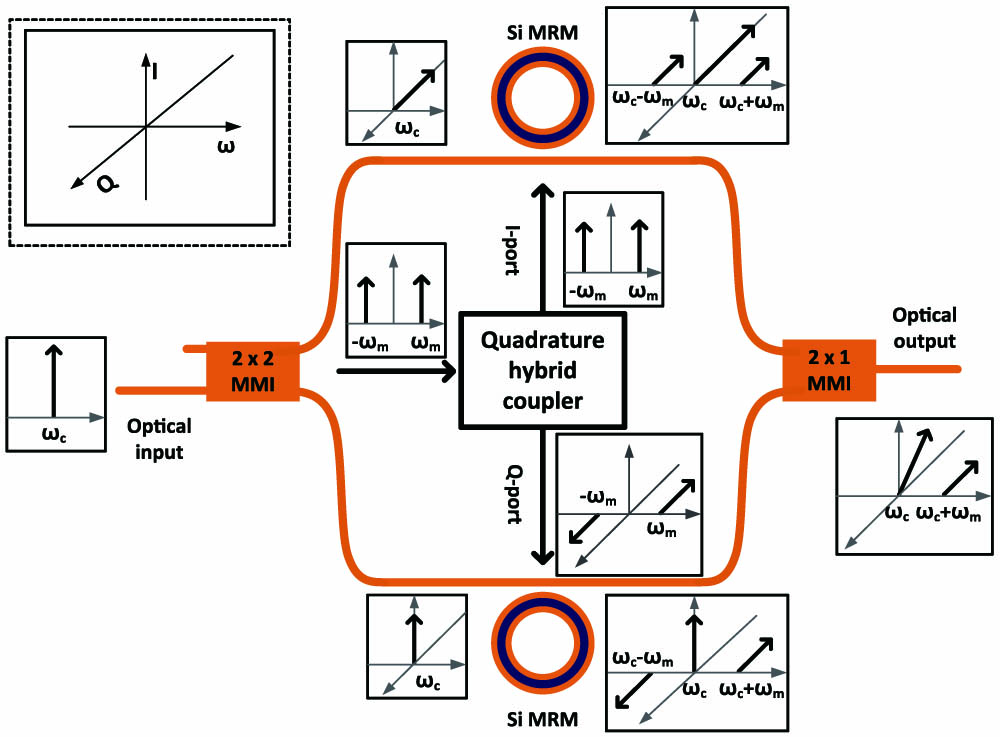
    Fig. 1. Block diagram of the OSSB modulator.
    Microphotograph of the integrated Si OSSB modulator.
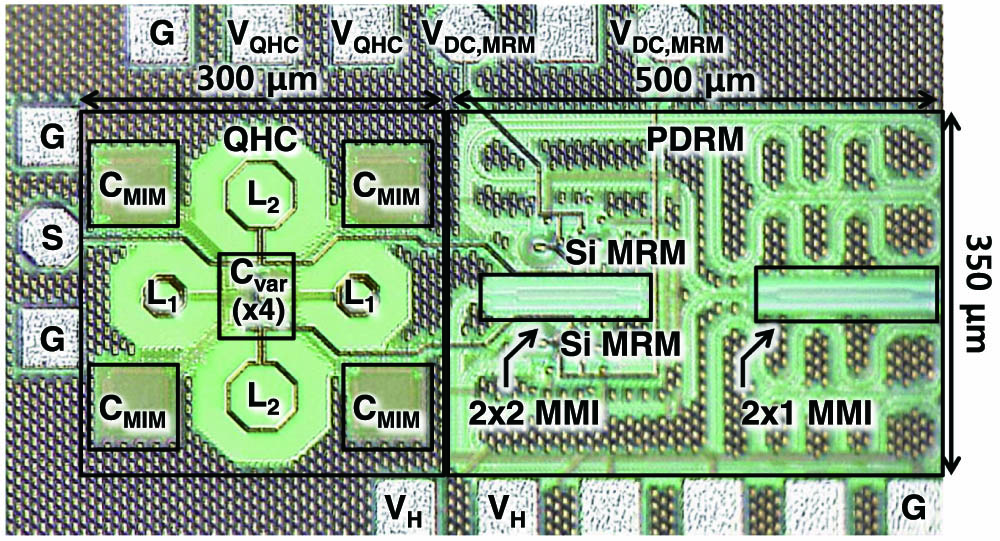
    Fig. 2. Microphotograph of the integrated Si OSSB modulator.
    (a) Structure and (b) cross section and the electrical model of the Si MRM.
    Fig. 3. (a) Structure and (b) cross section and the electrical model of the Si MRM.
    Measured and simulated electrical S11 (a) magnitude and (b) phase of the Si MRM. For simulation, extracted values shown in Table 1 are used.
    Fig. 4. Measured and simulated electrical S11 (a) magnitude and (b) phase of the Si MRM. For simulation, extracted values shown in Table 1 are used.
    Measured optical transmission spectra of the Si MRM at different bias voltages.
    Fig. 5. Measured optical transmission spectra of the Si MRM at different bias voltages.
    (a) Simulated modulation frequency response and (b) measured and simulated optical spectrum for Si MRM modulated at 30 GHz with D=90 pm.
    Fig. 6. (a) Simulated modulation frequency response and (b) measured and simulated optical spectrum for Si MRM modulated at 30 GHz with D=90  pm.
    Schematic of the QHC.
    Fig. 7. Schematic of the QHC.
    Simulated (a) magnitude of and (b) phase difference between I/Q output signals for the QHC with Si MRM loads.
    Fig. 8. Simulated (a) magnitude of and (b) phase difference between I/Q output signals for the QHC with Si MRM loads.
    Measured and simulated for (a) magnitude of and (b) phase difference between QHC I/Q output signals with 50 Ω loads.
    Fig. 9. Measured and simulated for (a) magnitude of and (b) phase difference between QHC I/Q output signals with 50 Ω loads.
    Measured optical transmission spectra of the PDRM (a) without temperature control and zero bias voltage and (b) with temperature control at three different bias voltages. (c) Measured OSSB modulator output optical spectrum when modulated with 30 GHz, 2 Vpp sinusoidal signals at D=90 pm and 1 V bias voltage.
    Fig. 10. Measured optical transmission spectra of the PDRM (a) without temperature control and zero bias voltage and (b) with temperature control at three different bias voltages. (c) Measured OSSB modulator output optical spectrum when modulated with 30 GHz, 2 Vpp sinusoidal signals at D=90  pm and 1 V bias voltage.
    Measured output spectra of the OSSB modulator with different modulation frequencies.
    Fig. 11. Measured output spectra of the OSSB modulator with different modulation frequencies.
    ParameterValue
    Rs(=Rn+Rp)220 Ω
    Cj10.5 fF
    Cox(=Cn+Cp)8.5 fF
    Rsub4.2 kΩ
    Table 1. Numerical Values for MRM Electrical Parameters
    ParameterValue
    L1580 pH
    L2410 pH
    C97 fF
    Table 2. L and C Values Used for QHC Implementation
    Byung-Min Yu, Jeong-Min Lee, Christian Mai, Stefan Lischke, Lars Zimmermann, Woo-Young Choi. Single-chip Si optical single-sideband modulator[J]. Photonics Research, 2018, 6(1): 6
    Download Citation