Rumao Tao, Long Huang, Pu Zhou, Lei Si, Zejin Liu. Propagation of high-power fiber laser with high-order-mode content[J]. Photonics Research, 2015, 3(4): 192
Copy Citation Text
Propagation properties of high-power fiber laser with high-order-mode (HOM) content are studied numerically for the first time to the best of our knowledge. The effect of HOM on the propagation property is evaluated by the power in the bucket (PIB) metric. It is shown that PIB is mainly dependent on HOM content rather than the relative phase between the fundamental mode and HOM. The PIB in vacuum is more than 80% when the power fraction of the HOM is controlled to be less than 50% at 5 km. The relative phase has an impact on the peak intensity position and concentration of the far-field intensity distribution. If an adaptive optics system is used to correct the peak intensity deviation, the results indicate that there exists a maximal value of PIB as relative phase increases. Such effect is weakened when propagating in turbulence. Compared to the laser beams without HOM, laser beams with HOM content are less influenced by the turbulence and can reduce average intensity fluctuation. The results may be useful in the design of a high-power fiber laser system.
Optical propagation of laser beams in vacuum and turbulent atmosphere has been widely studied, and investigation of the propagation properties of laser beams through turbulence atmosphere can provide useful reference for many important applications, such as free space optical communications, laser radar, light detection and ranging, and remote sensing and imaging [1–11]. Recently, with the development of high-brightness pump diodes and large mode area (LMA) double-clad fiber, ytterbium-doped fiber laser has evolved from lower-power setups to multi-kW industrial systems in the past decade [12], which results in the propagation of high-power fiber laser under intense study. Unfortunately, in a high-power laser system, the combination of high average power and LMA leads to the onset of mode instabilities (MIs) [13–15], which results in a laser beam with high order modes (HOMs). It should also be noted that, even when the MI does not occur, the output beam from LMA fiber is not free of HOM [16]. Although lots of methods to mitigate or eliminate HOM are proposed as well as increasing the threshold power of MI [17,18], significant progress has not been reported until now, which means, in practice applications, a high-power fiber laser free of HOM content is not possible at present. Propagation of fiber laser without HOM has been studied [9]. However, to the best of our knowledge, the propagation properties of fiber laser beams with HOM content have not yet been examined.
In this paper, the propagation of high-power fiber laser with HOM content is studied with the power in the bucket (PIB) being the evaluation criterion. Our aim is to find the tolerance of HOM content in the energy transmission application of high-power fiber laser and provide reference for the design of high-power laser system.
2. THEORETICAL MODEL
An optical field propagating in a weakly guiding step-index fiber can be locally expressed in terms of the so-called LP fiber modes (or LP modes), which are often used to express the exiting mode of the fiber laser [19]. The normalized electric field of mode can be written as where is the normalization factor, and, in step-index fibers, can be expressed as [20] and the normalization factor is where and is the Bessel function and modified Bessel function, respectively, is the core radius of the fiber, (, ) is the polar coordinates, is the core numerical aperture of the fiber, and is the wavelength.
Sign up for Photonics Research TOC. Get the latest issue of Photonics Research delivered right to you!Sign up now
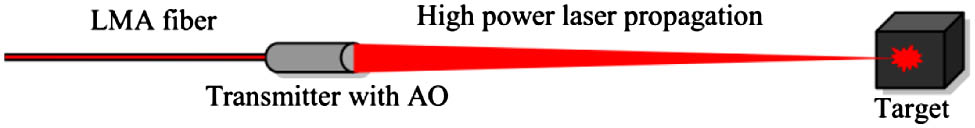
In general, dynamic energy transfer in MI most often happens between an and mode at the onset stage in refractive-guiding step-index fiber [13,14]. It is shown that perturbation coupling of the fundamental mode into the mode is the strongest [21–23] and its bend loss is relatively low, which makes this HOM ubiquitous and difficult to eliminate. Other higher modes can be eliminated by bend loss, so the remaining analysis presented in the paper will consider the set of modal superposition states consisting of different admixtures of the calculated and modes present at the near-field fiber output, where the electric field of the high-power fiber laser can be expressed as where is the power fraction in the mode and is the relative phase between the and modes. In practice, the laser from LMA fiber is launched from a transmitter with adaptive optics (AO), which can clean up the laser beam [24,25] and add tile phase at the transmitter plane to correct the beam pointing error (peak intensity deviation) caused by the HOM [16], as shown in Fig. 1. The optical field after the transmitter can be written as where is defined by Eqs. (1) and (2) with replaced by . is the magnification of the transmitter and is the distance to the target.
We model propagation of the laser beam through the turbulence volume as a sequence of 2D wave propagations from one thin phase screen to another using scalar diffraction theory [26–28]. Propagation of the complex wave amplitude function from the th to the phase screen is accomplished by first applying the phase screen aberration mask and then propagating the angular spectrum propagator a distance between the turbulence layers. The propagation of the optical field can be accomplished using a standard numerical propagation technique such as a fast Fourier transform (FFT)-based approach. This approach to model propagation is a Fourier domain technique, which can be written mathematically as where is the phase screen realizations that describes the phase aberration induced by atmospheric turbulence [ for propagation in vacuum]; is the wavenumber; , is the spatial frequency component along axis and axis, respectively; and , stand for direct and inverse Fourier transforms. The phase screens are generated by fast Fourier method with subharmonics [29]. To provide sufficient statistics for the calculations of average irradiance, the resulting intensity frames are averaged to create the simulated intensity profile of the beams [10,30].
3. NUMERICAL SIMULATIONS
A. Validation of the Simulation Code
To verify the simulation code, we compared simulation results with analytic results for a Gaussian beam. The analytic expressions for the Gaussian beam are presented here for reference. For a Gaussian beam field , after propagating a distance in turbulence, the optical intensity (irradiance) can be expressed as with where , , and , and is the wavenumber. is the peak intensity, is initial radius, is the wavelength, is the focus distance, and is the coherence length of a spherical wave and can be expressed as . is the structure constant, which represents the atmospheric turbulence strength. Figure 2 shows a comparison of simulation and analytic intensity patterns. The array size is points. One thousand phase screen realizations were averaged for the simulation intensity. , . The simulation and analytic profiles are identical, except for small random variations in the simulation intensity due to the finite number of frames. The simulation profiles become smoother as more frames are averaged.
Figure 2.Comparison between the analytic and simulated results when and .
We now perform some numerical calculations as examples to illustrate the propagation properties of fiber lasers with HOM content in vacuum. In accordance with Eqs. (1) and (2), the near-field intensity distribution of the fiber modes is plotted in Fig. 3. The laser is launched focally with , . The irradiance distribution for the fiber laser beams with HOM content is calculated and plotted in Fig. 4 with and . Here, dotted axes are used to denote the center of the target. It is shown that the HOM content will cause the deviation of the peak intensity and results in the beam-quality degradation.
Figure 3.Irradiance distribution of fiber modes. (a) ; (b) .
Figure 4.Irradiance distribution at . (a) Near-field intensity with . (b) Near-field intensity with , . (c) Far-field intensity with . (d) Far-field intensity with , .
Figure 5 plots the irradiance distribution with different power fractions and relative phases. It is shown in Figs. 5(a), 5(c), and 5(e) that the peak of the far-field irradiance varies with relative phases: the peak deviates to one side monotonously when increases from () to ; the peak deviates to another direction monotonously when increases from to . From Figs. 5(b), 5(d), 5(f), and 5(g), one can see that the deviation of the center becomes larger with longer propagation distance and larger power fraction of HOM content.
Figures 4 and 5 show a qualitative effect of HOM content on propagation. The beam quality factor should be introduced in order to obtain detailed and quantitative results. For the applications such as energy transmission, the power in a certain area on the target is a key parameter to the researcher’s concern. In order to characterize the beam quality, the PIB is chosen as the criterion, which is given by where is the bucket radius, is the irradiance, and the total power is normalized equal to 1. According to [31], bucket size with a diameter between 2 and 3 cm is useful for realistic application. A bucket diameter of 2.5 cm is chosen in our numerical calculation. The PIB as a function of and is shown in Fig. 6, where . Figure 6(a) reveals that PIB on the target is independent of . This indicates that PIB on the target decrease monotonically with the increase of and decreases more rapidly at longer propagation distance. We can also conclude that, if the power in the HOM is controlled to be less than 50%, the PIB above 80% can be achieved at a range less than 5 km.
Figure 6.PIB as a function of relative phase and HOM content . (a) . (b) .
If AO is used to correct the peak intensity deviation by adding a tilt phase, the PIB on the target with different power fractions and relative phases is shown in Fig. 7. In the numerical simulation, we chose the point with the highest peak intensity as the center of the bucket. This reveals that there exists an optimization of PIB as increase: the PIB increases with the increasing of until it reaches the maximal value; after the maximal value, PIB decreases with the increasing . The values of corresponding to the maximum PIB are kept the same () with different HOM power fractions, and the optimization is more obvious with higher HOM power fractions.
To further study the propagation properties of high-power fiber lasers with HOM content, we have studied the effects of HOM content in turbulence. The numerical modeling procedure is, thus: The initial fiber laser beam with optical field given in Eq. (5) is propagated from the initial plane to the second plane using the angular spectrum propagation method [10]; then, the phase screen, which represents the accumulated atmosphere turbulence effect through the propagation distance, is multiplied with the field at the second plane; the aforementioned process is repeated until the final distance is reached. Examples of phase screen used in the simulation are given in Fig. 8.
Figure 8.Example of phase screen used in numerical simulation. (a) . (b) .
The irradiance distribution for the fiber laser beams is plotted in Fig. 9 with . It is shown that the HOM content causes distortion of the laser beams.
Figure 9.Irradiance distribution at . (a) Without HOM content. (b) , .
Figure 10 plots the irradiance distribution with different turbulence strength and relative phases after propagation 1 km in turbulence. It is shown in Fig. 10(a) that the influence of turbulence has only made the beam become divergent without changing the peak position. The peak of the far-field irradiance also varies with relative phases in turbulence, as in Fig. 10(b): the peak deviates to one side monotonously when increases from () to ; the peak deviates to another direction monotonously when increases from to .
The PIB as a function of is shown in Fig. 11. The parameters are taken the same as in Fig. 5. This indicate that PIB on the target decreases monotonically with the increase of , except for some random deviations due to the finite number of frames. Compared with the results in Fig. 6(b), it can be realized that the influence of HOM content is weakened when the laser beams propagate in the turbulence.
The PIB as a function of turbulence strength () is calculated and plotted in Fig. 12 with . It is shown that the laser beams with HOM are less influenced by the turbulence, which means that laser beams without HOM content are superior to the laser beams with HOM content in the case of turbulence propagation.
Figure 12.PIB as a function of turbulence strength.
Atmospheric turbulence also results in the average intensity fluctuation, which is one of the key concerns for a free space optical communications application. To quantitatively characterize this fluctuation, we calculated the scintillation index , which is defined as where represents an ensemble average. The on axis as a function of turbulence strength is plotted in Fig. 13, which indicated that laser beams with HOM content has smaller and can reduce intensity fluctuation.
Figure 13.SI as a function of turbulence strength.
With the peak deviation corrected by AO system, PIB on the target with different is shown in Fig. 14. Take the case of , for example; it is shown that the PIB is increased by 21% from 0.657 to 0.792 with , by 16% from 0.42 to 0.49 with , and by 12% from 0.268 to 0.30 with , which reveals that there also exists an optimization of PIB as increase in turbulence, but the optimization effect of PIB is weakened by stronger turbulence.
Figure 14.PIB as a function of . (a) . (b) . (c) .
Our study points out that PIB on the target is independent of the relative phase between the fundamental mode and HOM. The detailed reason can be obtained by the following derivation process:
Based on Huygens–Fresnel diffraction integral [6–8], the intensity distribution after propagation distance can be expressed as where denotes average over the ensemble of the turbulent medium. Take Eq. (5) into Eq. (11), we can obtain with
It can be seen that the term is influenced by the relative phase. For the special case that the intensity is located at the initial plane, can be obtained by using the properties of a Bessel function. For the general case that the plane is not the transmitter plane, by numerical integral, we also found that , which results that PIB on the target is independent of the relative phase between the fundamental mode and HOM.
It is shown in [32] that the power content as well as the phase among modes changes dramatically once the MI threshold has been reached. Based on the aforementioned study, the change of the relative phase has no effect on the PIB. However, the change in the power content has a significant impact on the PIB. In a future study, it is more important to reduce the HOM content than to control the relative phase.
A recent proposed approach to mitigate the effect of MI has proven to control the HOM content less than 50% when the lasing power is 300% of the threshold power [17]. Based on the study in Section 3, the improved lasing output obtained by the method is deployable in practice.
5. CONCLUSIONS
In conclusion, propagation of a high-power fiber laser with HOM content is studied by numerical simulation. It is shown that the PIB is mainly dependent on HOM content instead of the relative phase, and, if the power in the HOM is controlled to be less than 50%, the PIB in vacuum is more than 80%, which means the laser beam could be applied for practical use. The relative phase mainly has an impact on the peak intensity of the far-field intensity distribution. If AO is used to correct the peak intensity deviation, the results indicate that there exists an optimization of PIB as an increase in relative phase, and the corresponding relative phase of the optimal value is . There also exist an optimization of PIB in turbulence, but the optimization effect of PIB becomes weakened with stronger turbulence.
[26] J. W. Goodman. Introduction to Fourier Optics(1968).
[27] J. A. Fleck, J. R. Morris, M. D. Feit. Time dependent propagation of high energy laser beam through the atmosphere. Appl. Phys., 11, 329-335(1977).
Rumao Tao, Long Huang, Pu Zhou, Lei Si, Zejin Liu. Propagation of high-power fiber laser with high-order-mode content[J]. Photonics Research, 2015, 3(4): 192