• Spectroscopy and Spectral Analysis
  • Vol. 42, Issue 3, 719 (2022)
Jie-hong CHENG1、*, Zheng-guang CHEN1、1; 2; *;, and Shu-juan YI2、2;
Author Affiliations
  • 11. College of Information and Electrical Engineering, Heilongjiang Bayi Agricultural University, Daqing 163319, China
  • 22. Heilongjiang Engineering Technology Research Center for Rice Ecological Seedlings Device and Whole Process Mechanization, Daqing 163319, China
  • show less
    DOI: 10.3964/j.issn.1000-0593(2022)03-0719-07 Cite this Article
    Jie-hong CHENG, Zheng-guang CHEN, Shu-juan YI. Wavelength Selection Algorithm Based on Minimum Correlation Coefficient for Multivariate Calibration[J]. Spectroscopy and Spectral Analysis, 2022, 42(3): 719 Copy Citation Text show less
    Average value and standard deviation of correlation coefficient
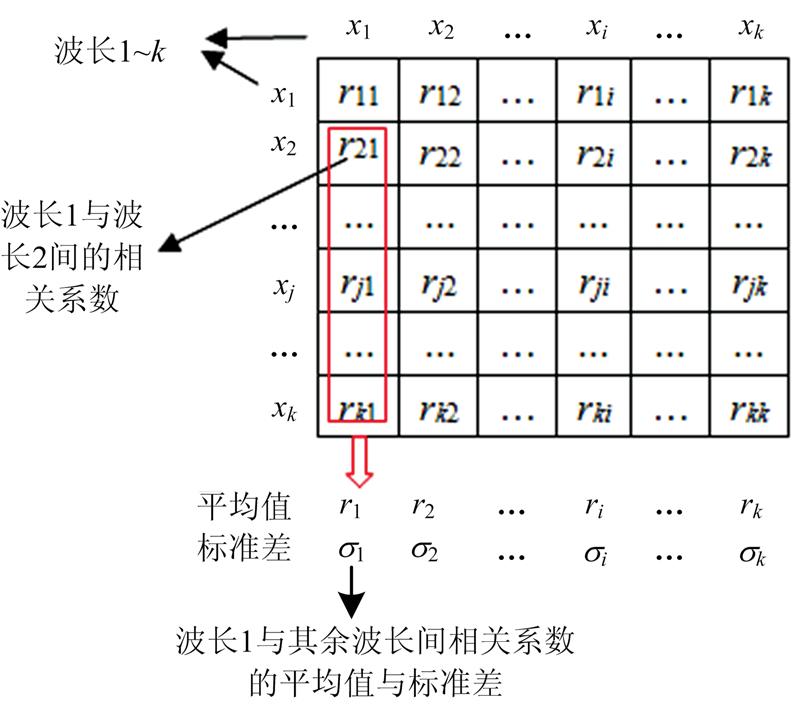
    Fig. 1. Average value and standard deviation of correlation coefficient
    Graphic analysis of threshold in grid T
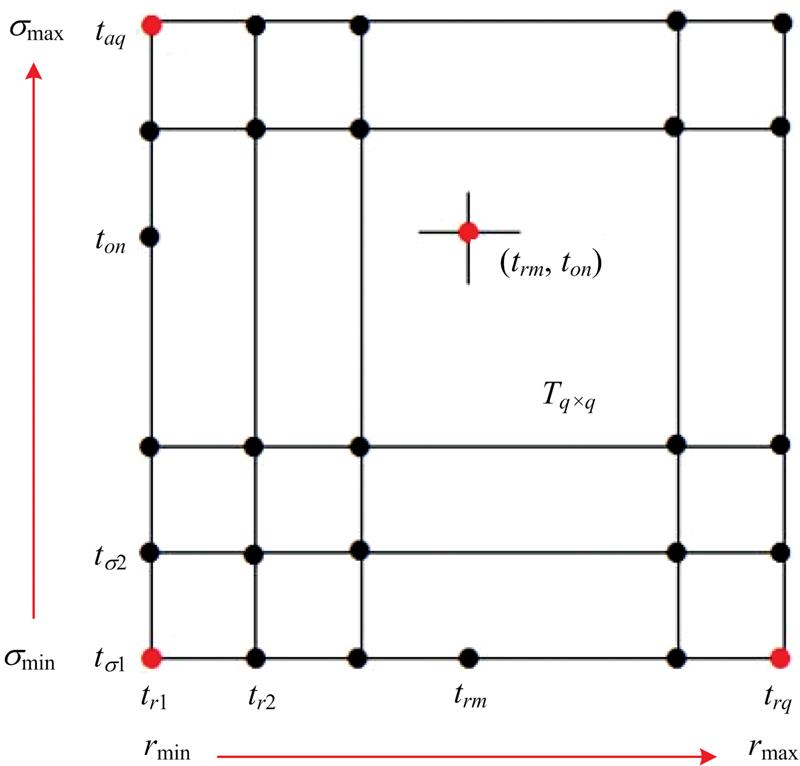
    Fig. 2. Graphic analysis of threshold in grid T
    Original (a) and Preprocessed (b) NIR spectra of diesel fuels sample
    Fig. 3. Original (a) and Preprocessed (b) NIR spectra of diesel fuels sample
    Wavelength selection results by MCC
    Fig. 4. Wavelength selection results by MCC
    Mean and standard deviation of correlation coefficient between selected wavelengths
    Fig. 5. Mean and standard deviation of correlation coefficient between selected wavelengths
    Changes in RMSEV value of MCC-MLR model under different threshold coefficients
    Fig. 6. Changes in RMSEV value of MCC-MLR model under different threshold coefficients
    相关系数绝对值相关强度
    0.8~1.0极强相关
    0.6~0.8强相关
    0.4~0.6中等程度相关
    0.2~0.4弱相关
    0.0~0.2极弱相关或无相关
    Table 1. The strength of correlation corresponding to the correlation coefficient between variables
    性质样本集样本数最小值最大值平均值标准差变异系数/%
    Dataset1(BP50)Whole set246197293258.3817.066.6
    Calibration set148197293256.3219.197.5
    Validation set49201280260.8612.834.9
    Prediction set49198283262.1212.624.8
    Dataset2(SOM)Whole set10842.9195.8585.4310.8212.7
    Calibration set6542.9195.8582.5212.8215.5
    Validation set2276.7493.2488.304.795.4
    Prediction set2186.6593.4691.401.631.8
    Table 2. Results of sample chemical property
    No.建模方法波长
    Validation setPrediction set
    R2RMSER2RMSE
    1FULL-PLSR4010.865 04.677 80.905 23.946 8
    2SPA-MLR250.953 62.834 50.953 92.844 9
    3CARS-PLSR180.928 94.760 10.927 93.544 5
    4IRIV-PLSR600.966 43.274 70.956 82.639 6
    5RF-PLSR340.948 04.071 90.943 43.009 9
    6MCC-MLR200.953 92.760 10.956 02.779 2
    Table 3. Model results based on different wavelength selection methods for diesel fuels datasets
    No.建模方法波长
    Validation setPrediction set
    R2RMSER2RMSE
    1FULL-PLSR8500.585 23.229 90.656 22.917 6
    2SPA-MLR230.953 90.908 90.810 11.870 9
    3CARS-PLSR90.975 51.803 90.908 81.368 2
    4IRIV-PLSR330.912 41.182 50.910 61.027 9
    5RF-PLSR250.898 81.282 70.807 42.108 4
    6MCC-MLR120.936 11.144 70.926 51.032 3
    Table 4. Model results based on different wavelength selection methods for soil datasets
    Jie-hong CHENG, Zheng-guang CHEN, Shu-juan YI. Wavelength Selection Algorithm Based on Minimum Correlation Coefficient for Multivariate Calibration[J]. Spectroscopy and Spectral Analysis, 2022, 42(3): 719
    Download Citation