• Chinese Optics Letters
  • Vol. 17, Issue 1, 011701 (2019)
C. Kharmyssov1, M. W. L. Ko2、*, and J. R. Kim1
Author Affiliations
  • 1School of Engineering, Nazarbayev University, Astana 010000, Kazakhstan
  • 2The University of Hong Kong, Pokfulam, Hong Kong, China
  • show less
    DOI: 10.3788/COL201917.011701 Cite this Article Set citation alerts
    C. Kharmyssov, M. W. L. Ko, J. R. Kim. Automated segmentation of optical coherence tomography images[J]. Chinese Optics Letters, 2019, 17(1): 011701 Copy Citation Text show less
    SDOCT image with retinal pigment epithelium layers (RPE, solid red line), internal limiting membrane (ILM, solid green line), and choroid representation.
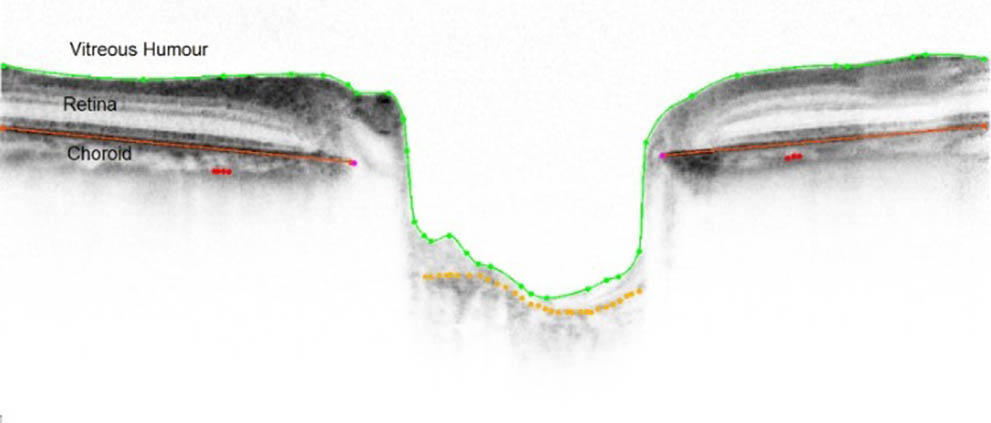
    Fig. 1. SDOCT image with retinal pigment epithelium layers (RPE, solid red line), internal limiting membrane (ILM, solid green line), and choroid representation.
    Overview of automatic segmentation of the ILM and RPE layers in SDOCT images.
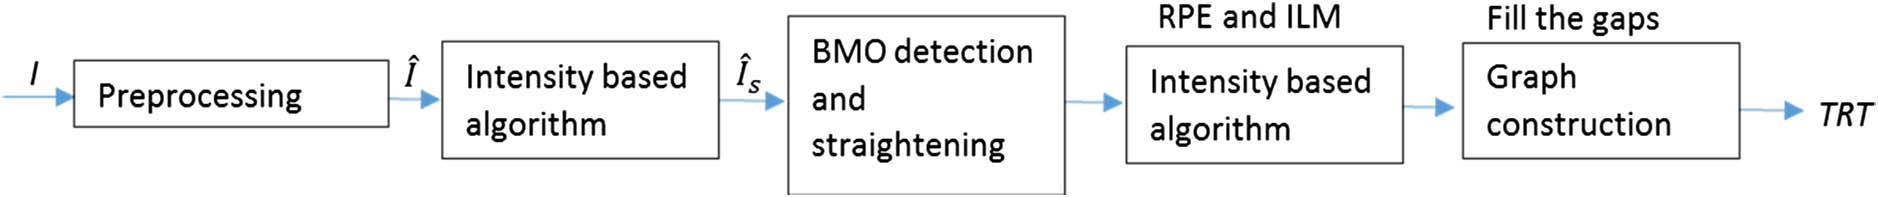
    Fig. 2. Overview of automatic segmentation of the ILM and RPE layers in SDOCT images.
    Example of the ILM layer (blue line) and RPE layer (red line) segmentation with the solely intensity-based algorithm.
    Fig. 3. Example of the ILM layer (blue line) and RPE layer (red line) segmentation with the solely intensity-based algorithm.
    Segmentation result of RPE (red line) and ILM (blue line) of the hybrid algorithm, which is solely a combination of intensity and graph-based algorithms after filling RPE gaps with the graph-based approach.
    Fig. 4. Segmentation result of RPE (red line) and ILM (blue line) of the hybrid algorithm, which is solely a combination of intensity and graph-based algorithms after filling RPE gaps with the graph-based approach.
    Depiction of the ONHSD, which represents an average of perpendicular distances from a red line joining two BMO points to the ILM layer.
    Fig. 5. Depiction of the ONHSD, which represents an average of perpendicular distances from a red line joining two BMO points to the ILM layer.
    Bland–Altman plot of the ONHSD measurement between the proposed hybrid algorithm and manual segmentation.
    Fig. 6. Bland–Altman plot of the ONHSD measurement between the proposed hybrid algorithm and manual segmentation.
    Illustration of the (a) raw image of ONH from SDOCT of a primary open-angle glaucoma patient and (b) automatically segmented image with the hybrid algorithm of ILM (blue line) and RPE (red line) layers.
    Fig. 7. Illustration of the (a) raw image of ONH from SDOCT of a primary open-angle glaucoma patient and (b) automatically segmented image with the hybrid algorithm of ILM (blue line) and RPE (red line) layers.
    AlgorithmProcessing time (s)AMRSD (µm)Dice’s coefficient (%)
    Intensity thresholding algorithm3.75.42±0.0396.8±1.7
    Graph-based algorithm34.324.7±0.2374.1±14.8
    Proposed hybrid algorithm9.35.73±0.0396.6±1.6
    Table 1. Summary of the Processing Time of One Image, Mean and Standard Deviation of ILM and RPE Comparison of Relative Difference with Manually Segmented Image, and Dice’s Coefficients of 120 Images
    AlgorithmRPEaILMa
    Intensity thresholding algorithm52.2±18.584.6±12.8
    Graph-based algorithm76.9±15.976.9±12.4
    Proposed hybrid algorithm88.3±9.588.5±9.8
    Table 2. Summary of RSPP Comparison for RPE and ILM Layers of 120 Images
    C. Kharmyssov, M. W. L. Ko, J. R. Kim. Automated segmentation of optical coherence tomography images[J]. Chinese Optics Letters, 2019, 17(1): 011701
    Download Citation