
Pengfei Li, Fei Zhang, Kai Li, Chen Cao, Yan Li, Jiachao Zhang, Bingzheng Yan, Zhenxu Bai, Yu Yu, Zhiwei Lv, Yulei Wang. Research progress of high-frequency and high-energy solid state lasers at 1.6 µm (invited)[J]. Infrared and Laser Engineering, 2023, 52(8): 20230403
- Infrared and Laser Engineering
- Vol. 52, Issue 8, 20230403 (2023)
![Blue line: Atmospheric transmittance; Red line: Maximum permissible exposure [2]](/richHtml/irla/2023/52/8/20230403/img_1.jpg)
Fig. 1. Blue line: Atmospheric transmittance; Red line: Maximum permissible exposure [2]
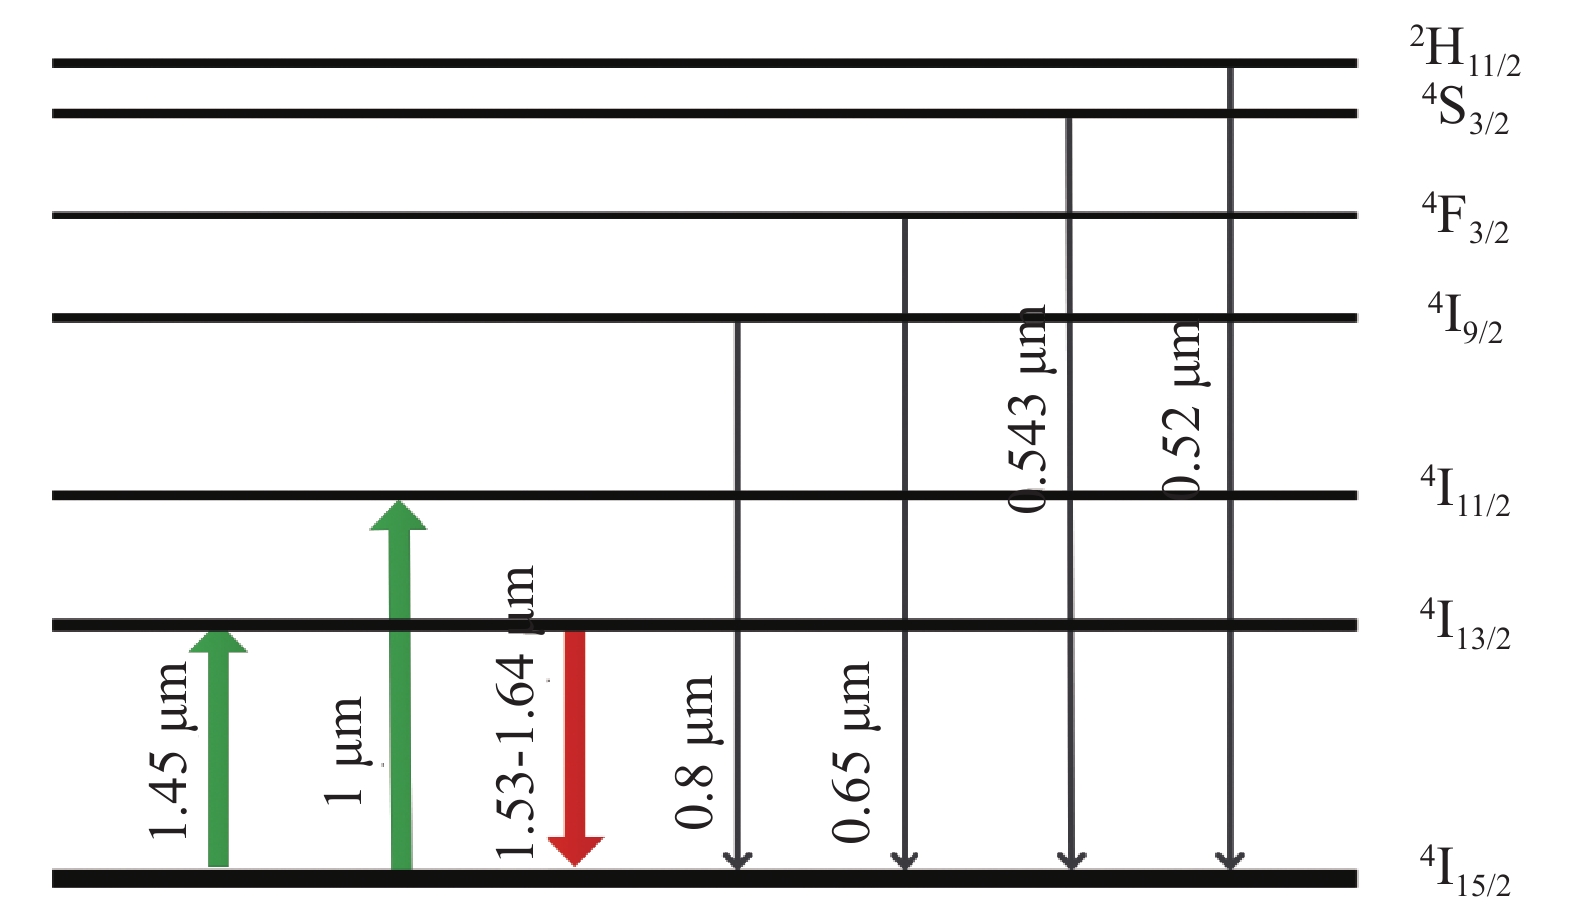
Fig. 2. Energy level jump diagram of Er3+ doped crystal
Fig. 3. Transmission spectral range of diamond crystals (uncoated)[44]
Fig. 4. Schematic diagram of the high-power diamond Raman laser[45]
Fig. 5. Schematic of wavelength tunable diamond Raman laser[55]
Fig. 6. Physical diagram of the OPO/OPA laser system[61]
Fig. 7. Pump spot and pulse width tunable OPO laser [62]
Fig. 8. Transmission rate of laser in KTA and KTP crystals at different wavelengths
Fig. 9. Ring cavity of KTA-OPO[65]
Fig. 10. Diagram of high conversion efficiency OPO optical path[66]
Fig. 11. Physical view of ring cavity KTA-OPO[67]
Fig. 12. Diagram of the wavelength-tunable OPO experimental setup[69]
Fig. 13. Diagram of the high-energy KTA-OPO experimental setup at 100 Hz[70]
Fig. 14. Schematic diagram of the experimental setup of KTA-OPO system[73]
|
Table 1. Example of obtaining a laser in the band near 1.6 µm using Er3+doped crystal as the gain medium
|
Table 2. Raman frequency shift, Raman linewidth, heat conductivity of conventional gain media
|
Table 3. Relevant research progress of conventional gain dielectric Raman lasers


Set citation alerts for the article
Please enter your email address

© Copyright 2018-2021 | Chinese Laser Press. All Rights Reserved 沪ICP备15018463号-20