
Liping Gong, Bing Gu, Guanghao Rui, Yiping Cui, Zhuqing Zhu, Qiwen Zhan, "Optical forces of focused femtosecond laser pulses on nonlinear optical Rayleigh particles," Photonics Res. 6, 138 (2018)
- Photonics Research
- Vol. 6, Issue 2, 138 (2018)
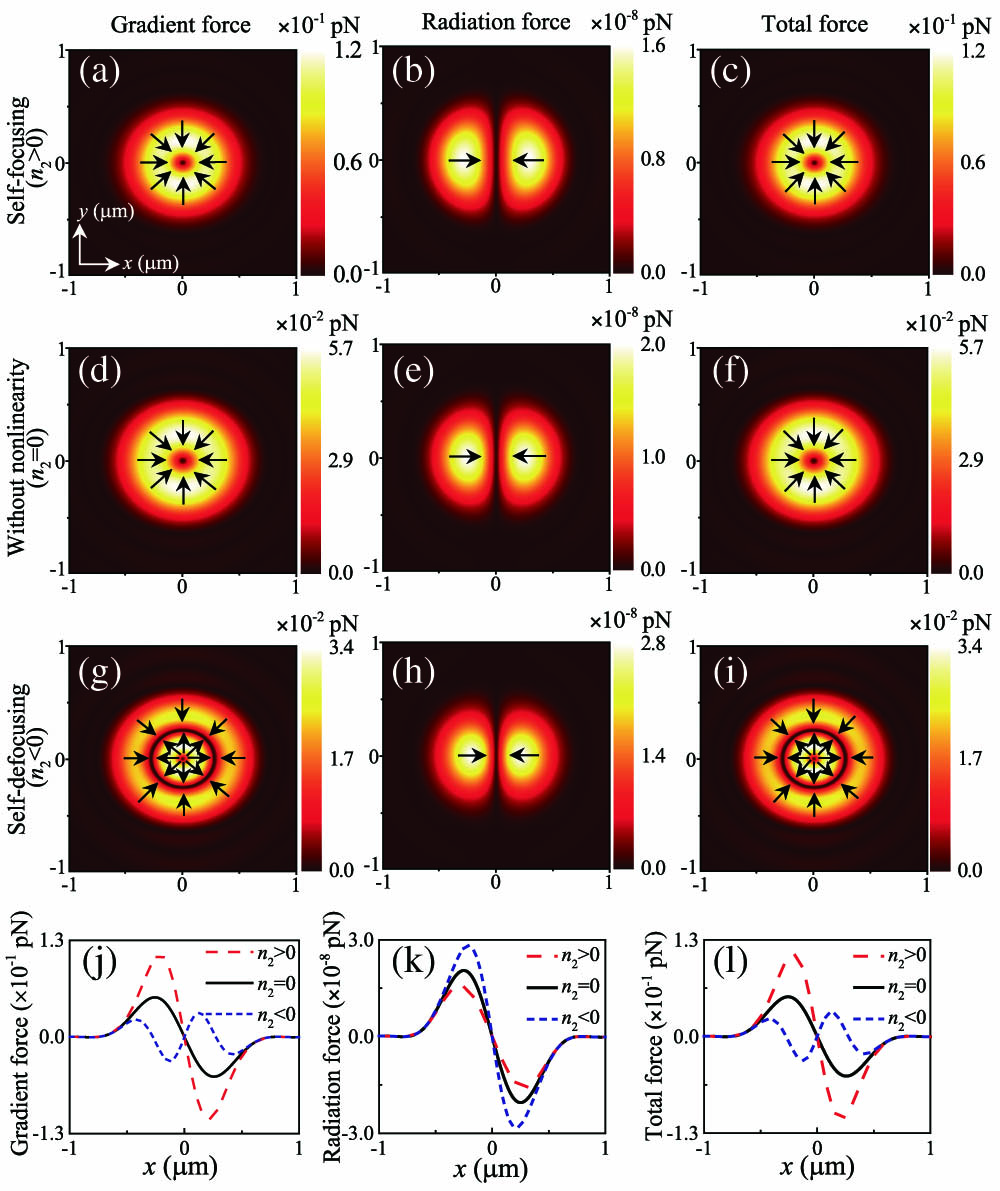
Fig. 1. Transverse force distributions produced by tightly focused laser pulses for the particle with self-focusing (n 2 = 5.9 × 10 − 17 m 2 / W n 2 = 0 n 2 = − 5.9 × 10 − 17 m 2 / W x - y z = 0 NA = 0.85 a = 40 nm x
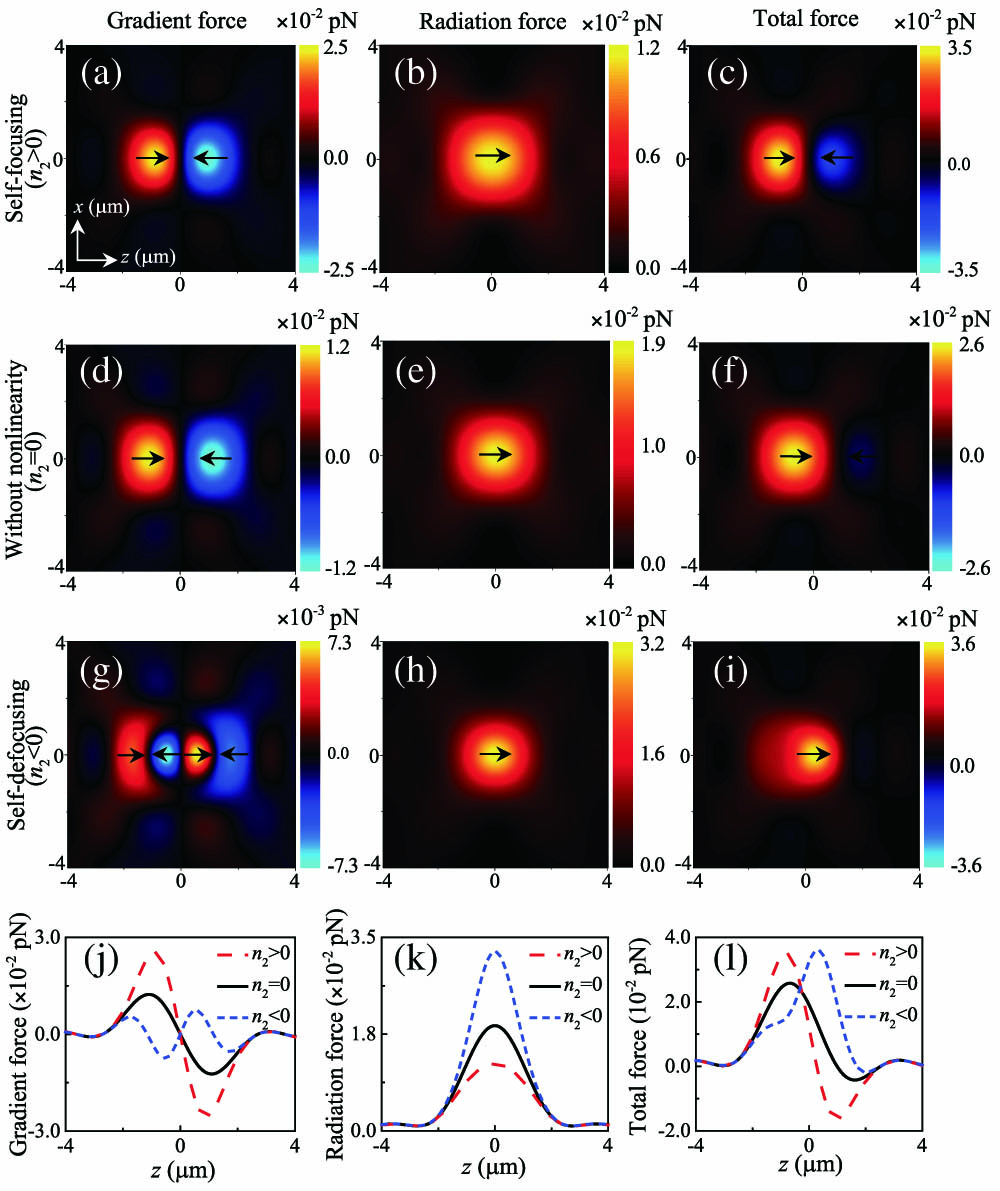
Fig. 2. Longitudinal force distributions produced by tightly focused laser pulses for the particle with self-focusing (n 2 = 5.9 × 10 − 17 m 2 / W n 2 = 0 n 2 = − 5.9 × 10 − 17 m 2 / W x - z y = 0 NA = 0.85 a = 40 nm z
Fig. 3. Force profiles along the x y = 0 z = 0 n 2 NA = 0.85 a = 40 nm n 2 = 6 × 10 − 17 m 2 / W a = 40 nm a n 2 = 6 × 10 − 17 m 2 / W NA = 0.85 F max n 2 a
Fig. 4. Trapping potential along (a) x z n 2 5.9 × 10 − 17 − 5.9 × 10 − 17 m 2 / W NA = 0.85 a = 40 nm


Set citation alerts for the article
Please enter your email address

© Copyright 2018-2021 | Chinese Laser Press. All Rights Reserved 沪ICP备15018463号-20