
Quan Lu, Zehao Zhang, Weiping Zhang, Yirong Liu. Point Spread Function Model of Grating Imaging System Based on Boltzmann Function Edge Fitting[J]. Acta Optica Sinica, 2020, 40(14): 1405003
- Acta Optica Sinica
- Vol. 40, Issue 14, 1405003 (2020)
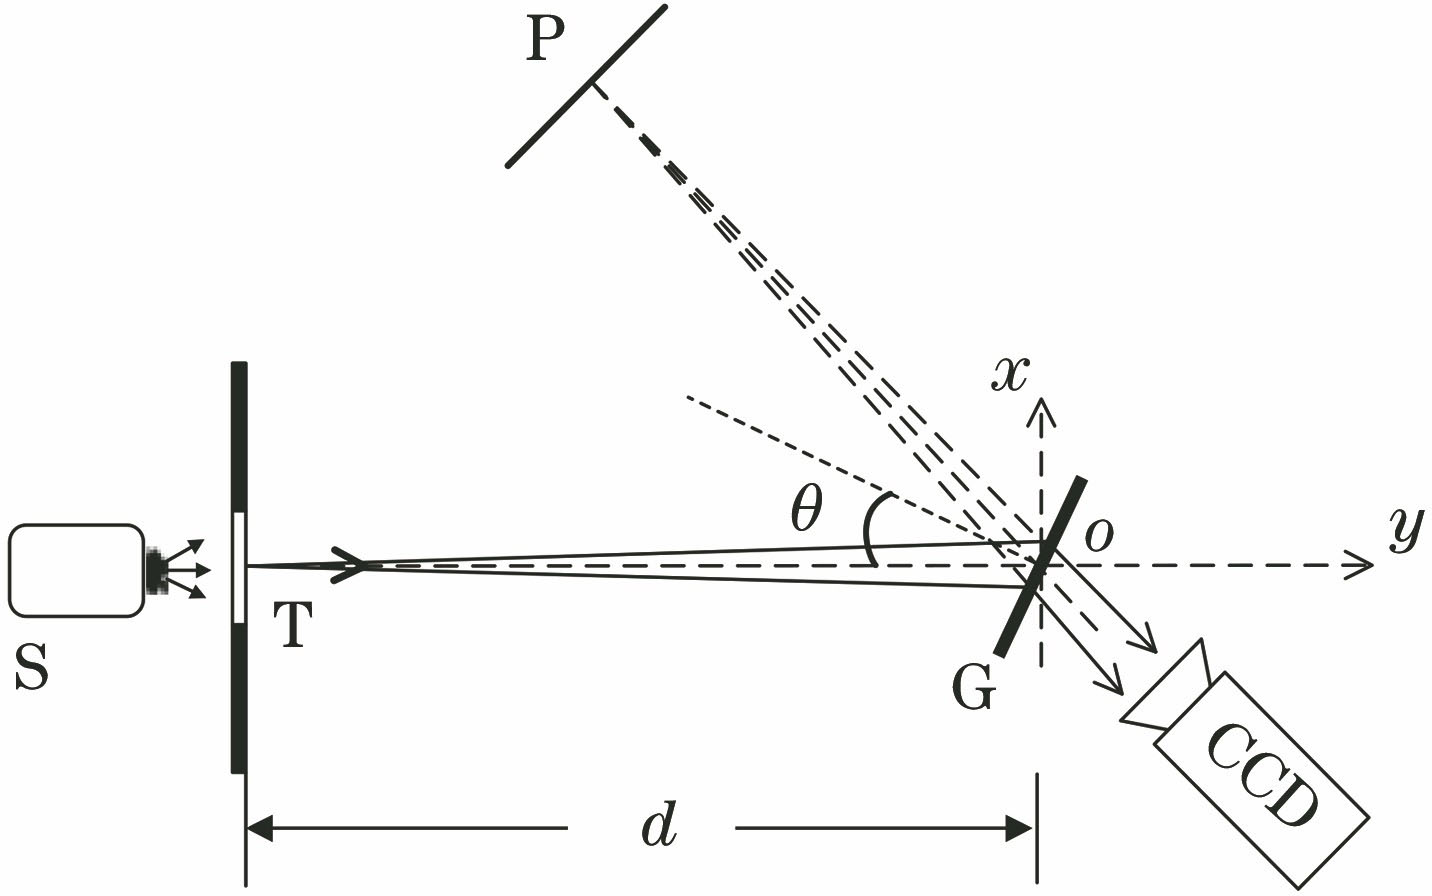
Fig. 1. Diagram of experimental light path
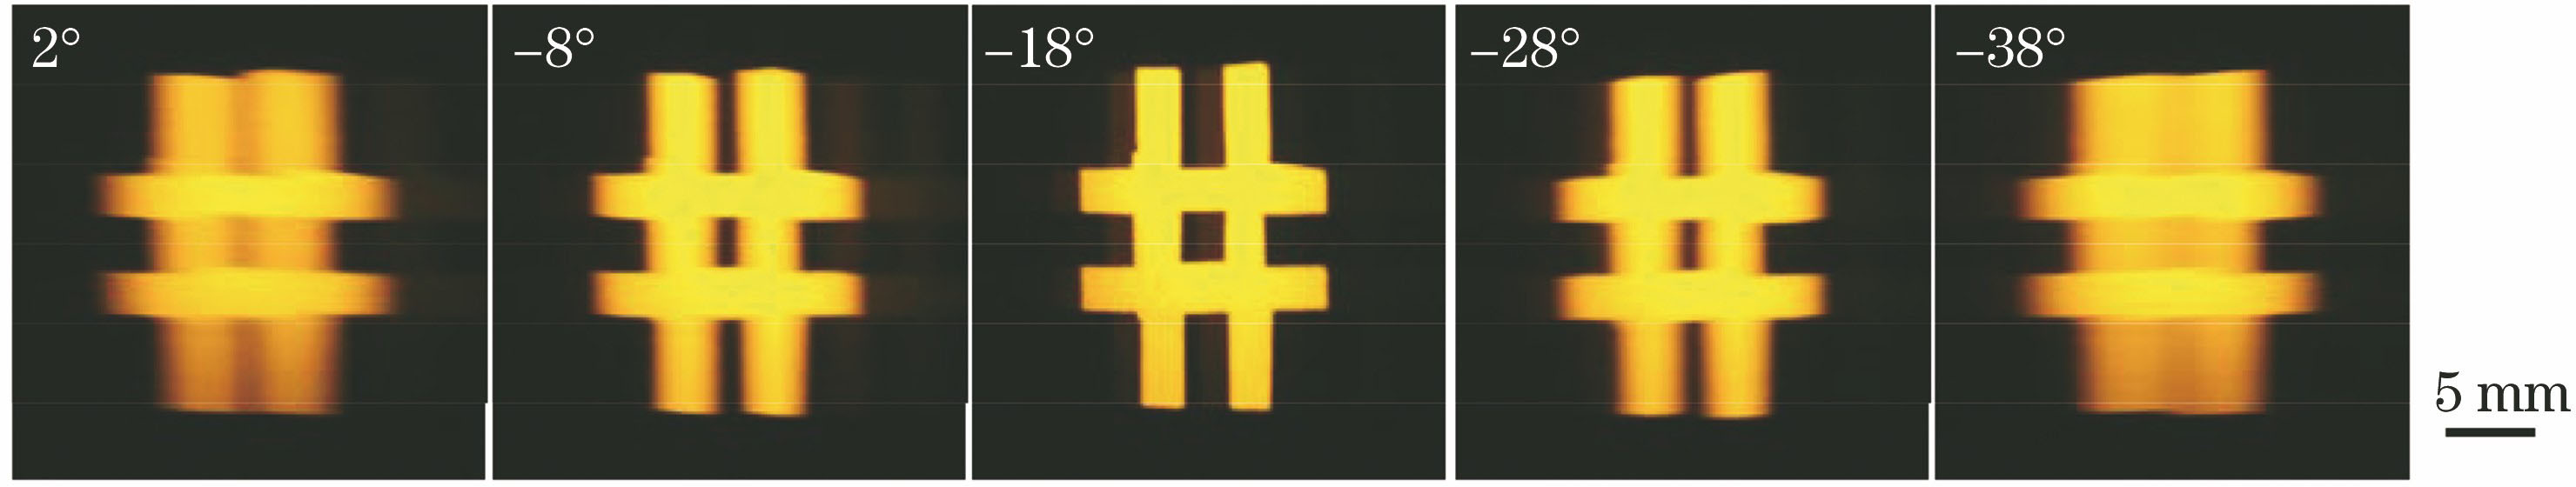
Fig. 2. Images formed by grating at partial incident angles
Fig. 3. Edge image and fitting effects of different functions. (a) Edge image; (b) fitting results of different functions; (c) local enlargement
Fig. 4. PSF of grating imaging at partial incident angles
Fig. 5. Diagram of sequential PSF
Fig. 6. Schematic of axial horizontal profile energy distribution
Fig. 7. Change of PSF radius under different light intensities
Fig. 8. Images formed by grating system
Fig. 9. Restored images
Fig. 10. Restoration comparison of different fitting functions. (a) Gauss function; (b) Hyperbolic function; (c) Boltzmann function
| |||||||||||||||||||||||||||||||||||||||||||||||||||||||||||||||||||||
Table 1. Fitting goodness of different functions on ESF
|
Table 2. Fitting parameters of curves under different light intensities
|
Table 3. Fitting goodness of curves under different light intensities
| ||||||||||||||||||||||||||||||||||||||||||||||||
Table 4. Quality evaluation before and after image restoration
| ||||||||||||||||||||||||||||||||||
Table 5. Quality evaluation of different fitting functions

Set citation alerts for the article
Please enter your email address
© Copyright 2018-2021 | Chinese Laser Press. All Rights Reserved 沪ICP备15018463号-20