
Li Xueting, Dang Jianwu, Wang Yangping, Gao Fanyi. Augmented Reality Recognition Registration Method Based on Text Features[J]. Laser & Optoelectronics Progress, 2020, 57(2): 21502
- Laser & Optoelectronics Progress
- Vol. 57, Issue 2, 21502 (2020)
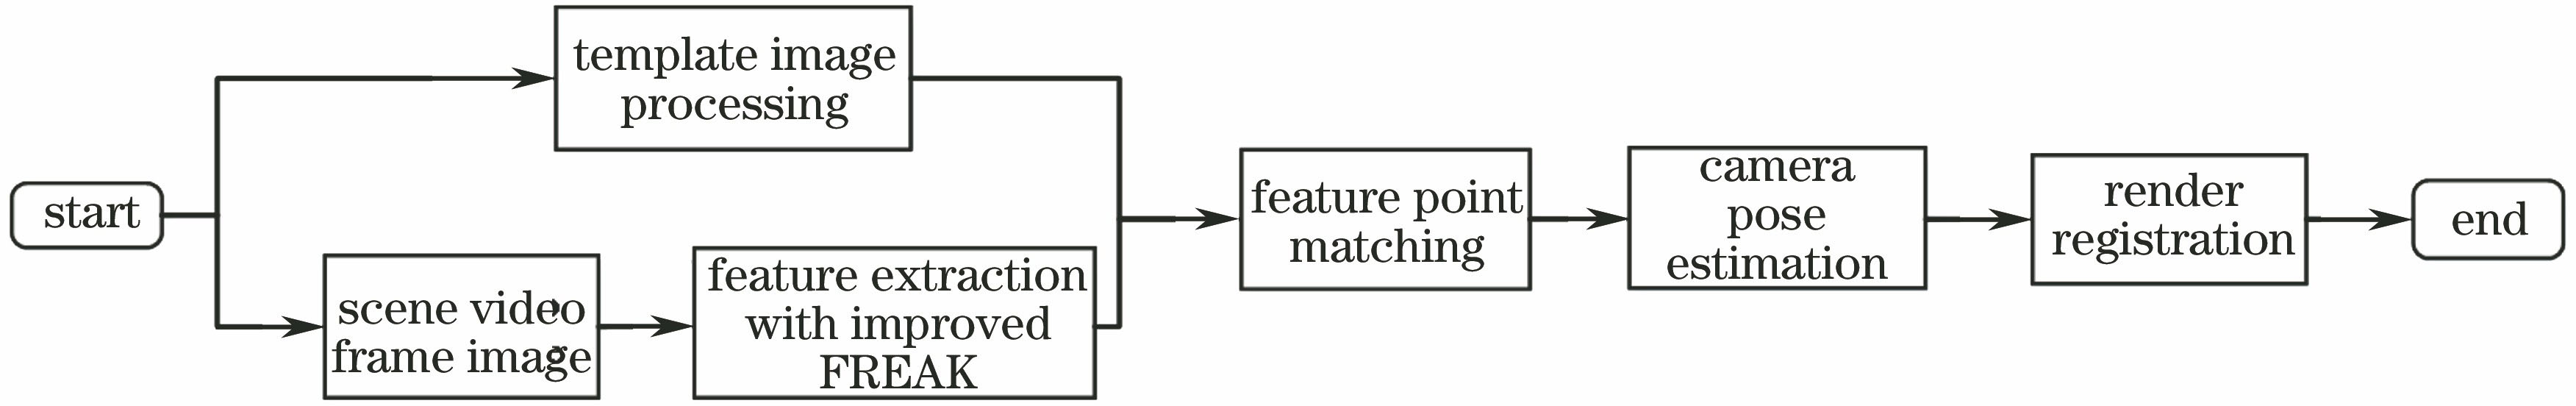
Fig. 1. AR recognition registration process based on text features
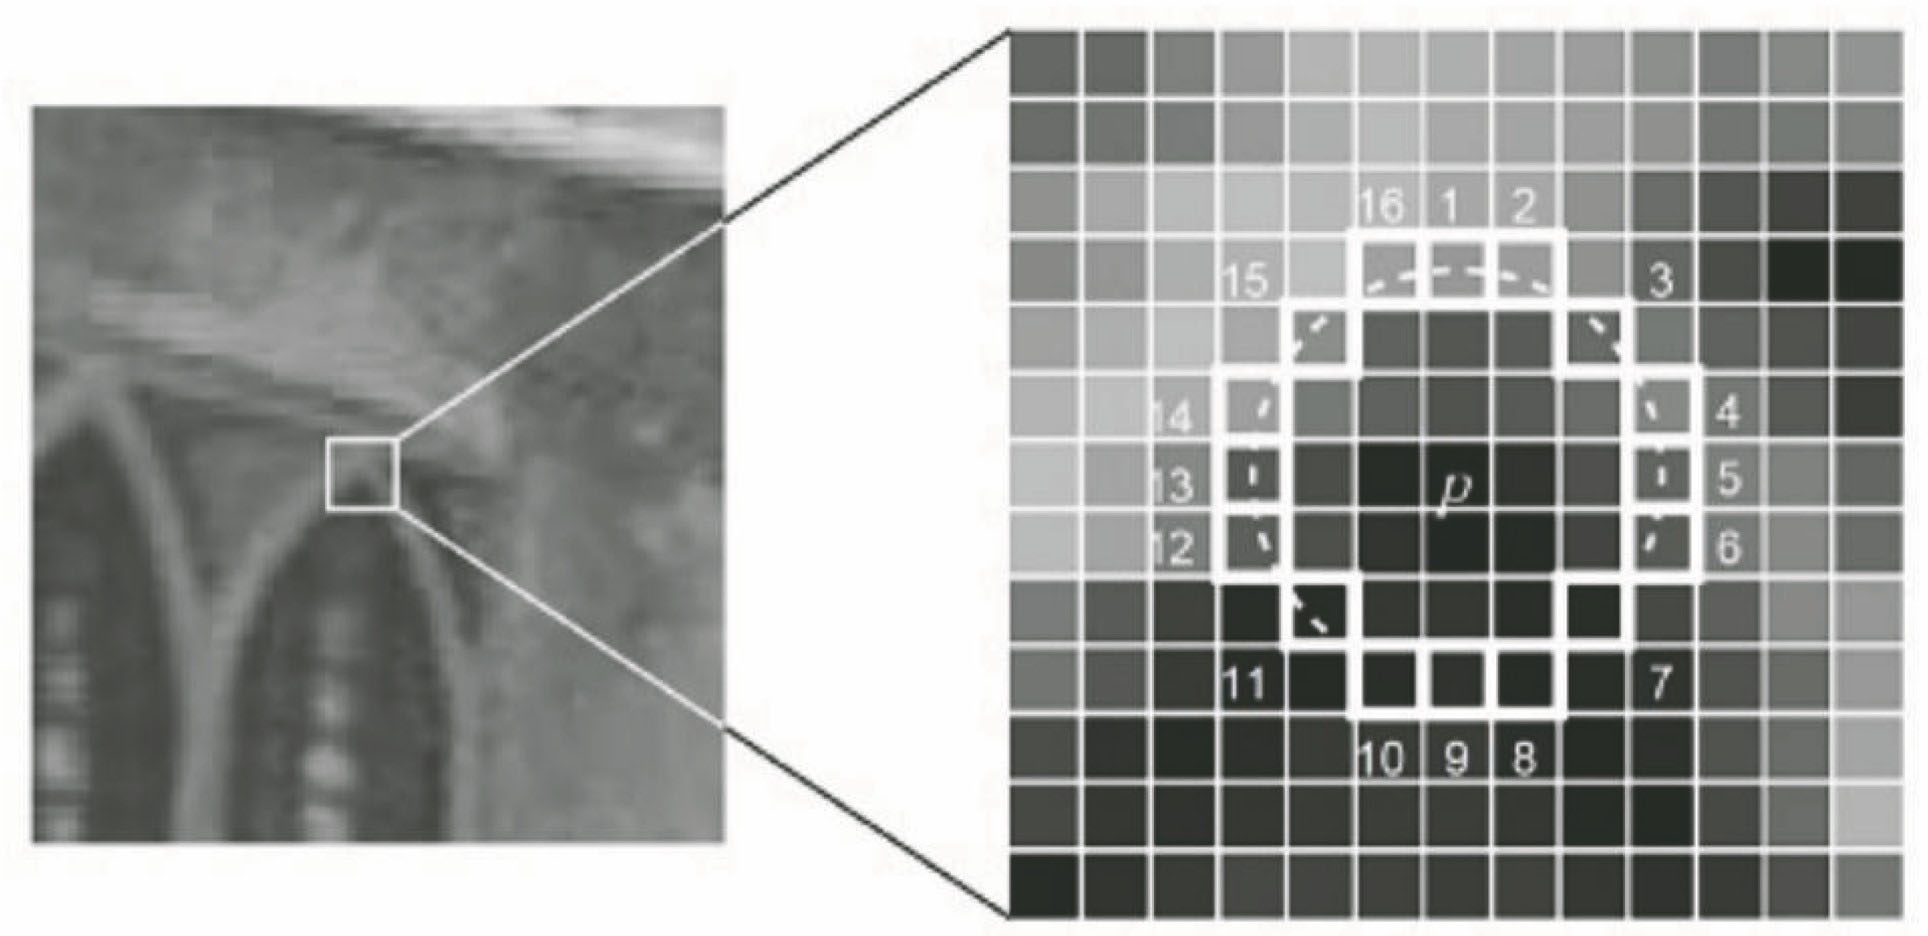
Fig. 2. FAST feature point detection
Fig. 3. FREAK retina sampling mode
Fig. 4. Center symmetrical sampling point pair
Fig. 5. Improved corner points of FASText
Fig. 6. Matching results of text images of class A. (a) SURF algorithm; (b) ORB algorithm;(c) FREAK algorithm; (d) improved FREAK algorithm
Fig. 7. Matching results of text images of class B. (a) SURF algorithm; (b) ORB algorithm;(c) FREAK algorithm; (d) improved FREAK algorithm
Fig. 8. Matching results of text images of class C. (a) SURF algorithm; (b) ORB algorithm;(c) FREAK algorithm; (d) improved FREAK algorithm
Fig. 9. Recognition registration for image A. (a) Positive registration; (b) distance and rotation change registration; (c) occlusion registration;(d) perspective change registration
Fig. 10. Recognition registration for image B. (a) Positive registration; (b) distance and rotation change registration; (c) occlusion registration;(d) perspective change registration
Fig. 11. Recognition registration for image C. (a) Positive registration; (b) distance and rotation change registration; (c) occlusion registration; (d) perspective change registration
| ||||||||||||||||||||||||||||||||||||||||||||||||||||||||||||||||||||||||||||||||||||||||||
Table 1. Comparison of average running time, average number of feature point pairs, and matching precision of algorithms
|
Table 2. Average processing time of different algorithmsms

Set citation alerts for the article
Please enter your email address
© Copyright 2018-2021 | Chinese Laser Press. All Rights Reserved 沪ICP备15018463号-20