• Acta Optica Sinica
  • Vol. 38, Issue 12, 1215009 (2018)
Xiuman Liang1、*, Wentao Liu1、*, Fusheng Niu2, and Tong Tian1
Author Affiliations
  • 1 College of Electrical Engineering, North China University of Science and Technology, Tangshan, Hebei 0 63210, China
  • 2 College of Mining Engineering, North China University of Science and Technology, Tangshan, Hebei 0 63210, China
  • show less
    DOI: 10.3788/AOS201838.1215009 Cite this Article Set citation alerts
    Xiuman Liang, Wentao Liu, Fusheng Niu, Tong Tian. Research on Measurement of Volume and Surface Area of Flotation Bubbles Based on Machine Vision[J]. Acta Optica Sinica, 2018, 38(12): 1215009 Copy Citation Text show less
    Experimental setup. (a) Front view; (b) top view
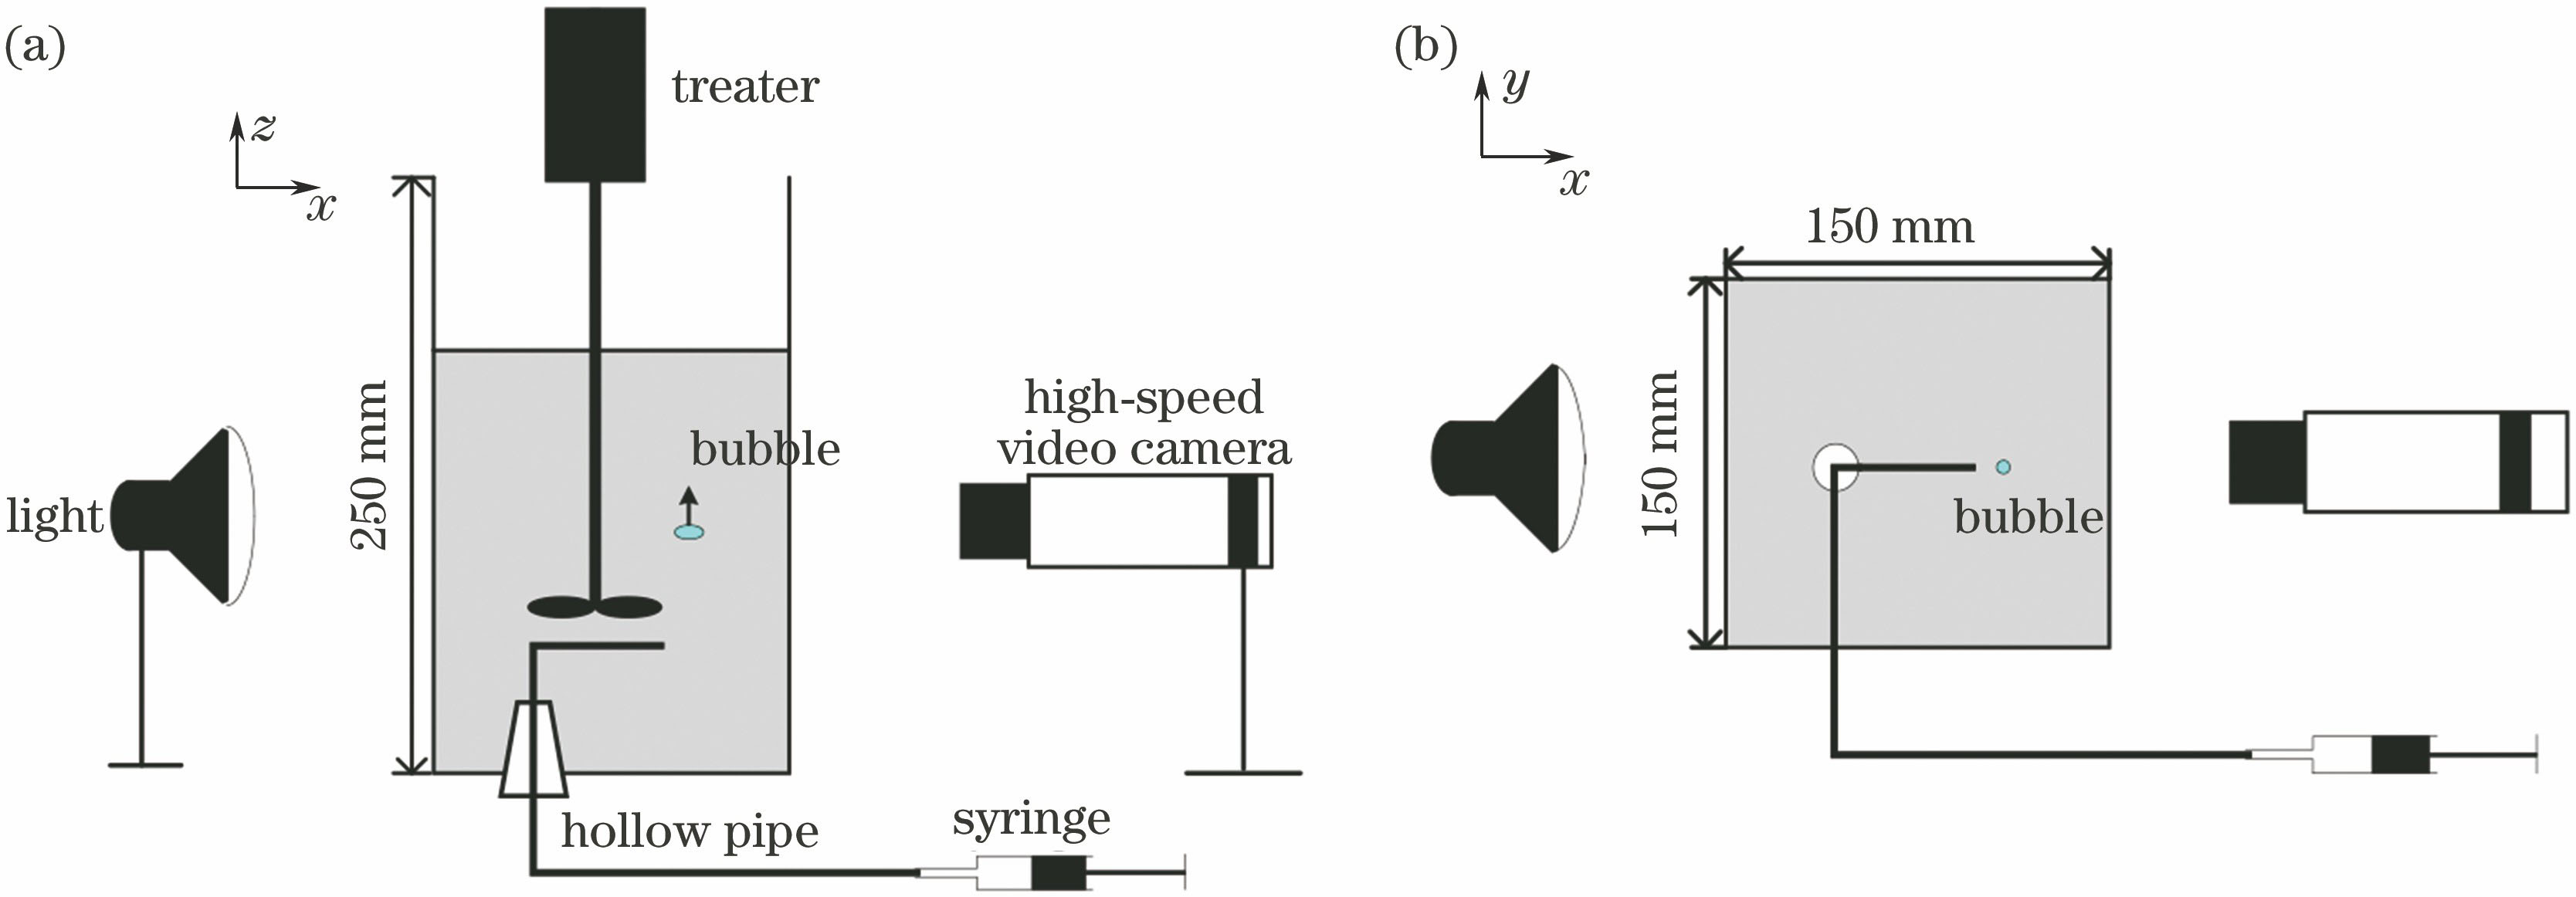
    Fig. 1. Experimental setup. (a) Front view; (b) top view
    Various forms of bubble images
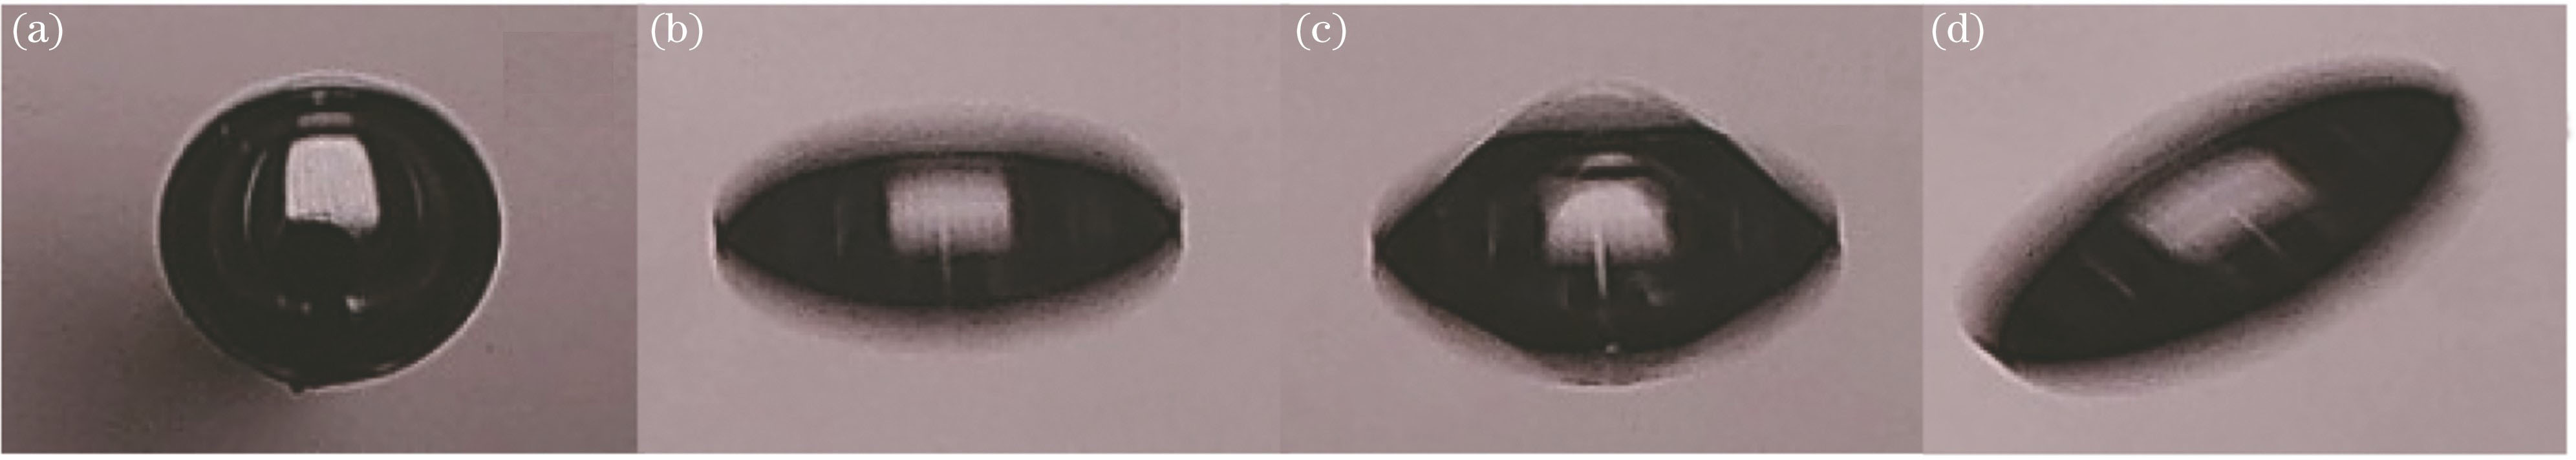
    Fig. 2. Various forms of bubble images
    Bubble projection image segmentation
    Fig. 3. Bubble projection image segmentation
    Edge extraction process. (a) Original image; (b) pre-processing; (c) Ostu partition; (d) edge swell; (e) region segmentation; (f) Canny edge extraction
    Fig. 4. Edge extraction process. (a) Original image; (b) pre-processing; (c) Ostu partition; (d) edge swell; (e) region segmentation; (f) Canny edge extraction
    Segmentation and reconstruction of overlapping bubbles
    Fig. 5. Segmentation and reconstruction of overlapping bubbles
    Scan bubble edge point
    Fig. 6. Scan bubble edge point
    Schematic of edge gradient
    Fig. 7. Schematic of edge gradient
    Comparison of edge extraction between SEE and TSED. (a) 623 lx; (b) 442 lx; (c) 276 lx
    Fig. 8. Comparison of edge extraction between SEE and TSED. (a) 623 lx; (b) 442 lx; (c) 276 lx
    Influence of parameter variation on HSDM calculation
    Fig. 9. Influence of parameter variation on HSDM calculation
    Bubble volume of different methods at different stirring rates
    Fig. 10. Bubble volume of different methods at different stirring rates
    Trend graph of measurement of bubble surface area
    Fig. 11. Trend graph of measurement of bubble surface area
    Experiment numberLength of front view /pixelLength of side view /pixelLength deviation /%
    152.353.72.7
    263.961.83.3
    358.957.62.2
    454.853.91.6
    556.758.83.7
    Table 1. Long axis parameters of bubble at different observation angles
    MethodAverage volume /mm3Deviation /%Variance /mm3
    HSDM1.0694.520.057
    HSM0.94215.890.121
    EVF1.0258.450.129
    EDM0.90419.300.076
    Table 2. Result comparison of different measurement methods
    Xiuman Liang, Wentao Liu, Fusheng Niu, Tong Tian. Research on Measurement of Volume and Surface Area of Flotation Bubbles Based on Machine Vision[J]. Acta Optica Sinica, 2018, 38(12): 1215009
    Download Citation